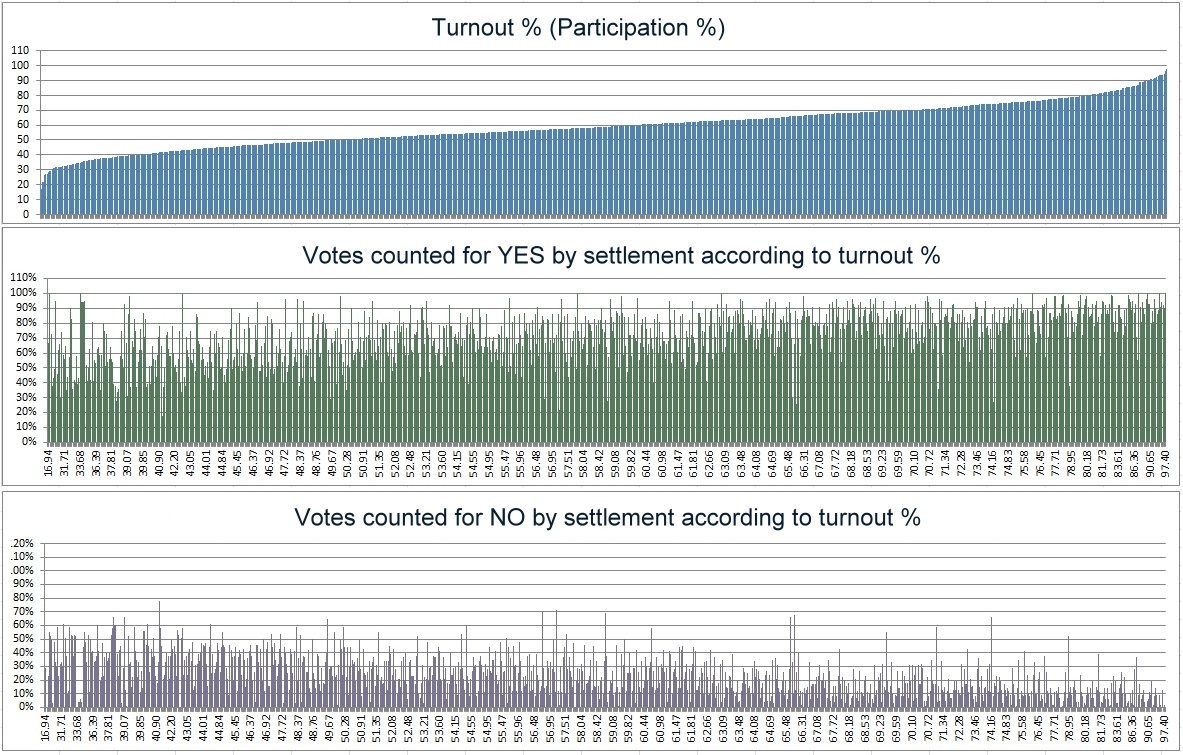
How to Read This Chart: YES and NO Vote Shares by Precinct Turnout
This scatter plot shows the relationship between voter turnout and the share of YES and NO votes across all polling stations in Armenia’s 2015 Constitutional Referendum. Each point on the chart represents a single polling station (precinct).
-
Horizontal Axis (X-axis — Turnout %): Shows the percentage of registered voters who participated in voting at each polling station, arranged from lowest turnout on the left to highest turnout on the right.
-
Vertical Axis (Y-axis — Vote Share %): Shows the percentage of votes cast for YES and NO at that polling station.
-
Upper Curve / Trendline (YES %): Shows how the share of YES votes rises as polling station turnout increases. In high-turnout precincts (on the right side of the chart), YES votes climb sharply toward 80%–100%.
-
Lower Curve / Trendline (NO %): Shows how the share of NO votes moves inversely to YES—remaining higher in lower- and moderate-turnout precincts and dropping sharply as turnout rises.
What to Look For: In an election without artificial turnout inflation, the ratio of YES to NO votes stays relatively consistent across low- and high-turnout precincts (forming roughly flat horizontal bands). A steep upward slope in the YES curve alongside a steep downward slope in the NO curve at high turnout indicates that higher reported turnout was disproportionately concentrated in favor of YES.