Armenia 2012: Two Yerevan Polling Stations Where the Turnout Count Fell, Chart by Chart
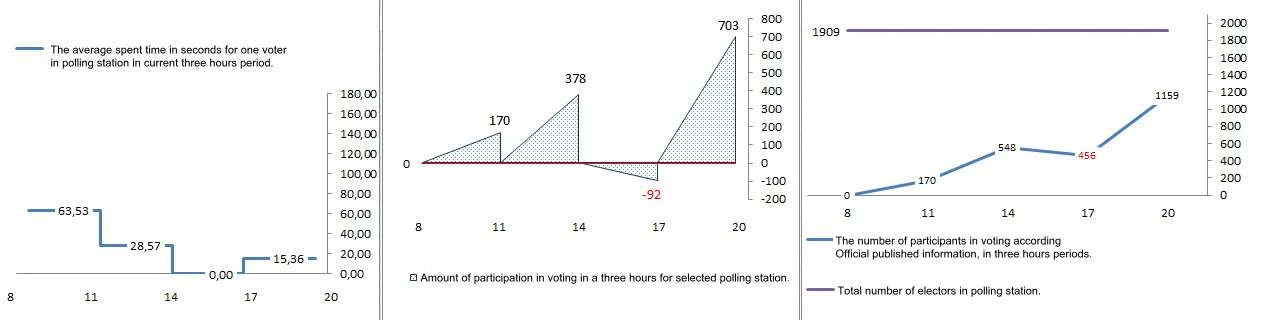
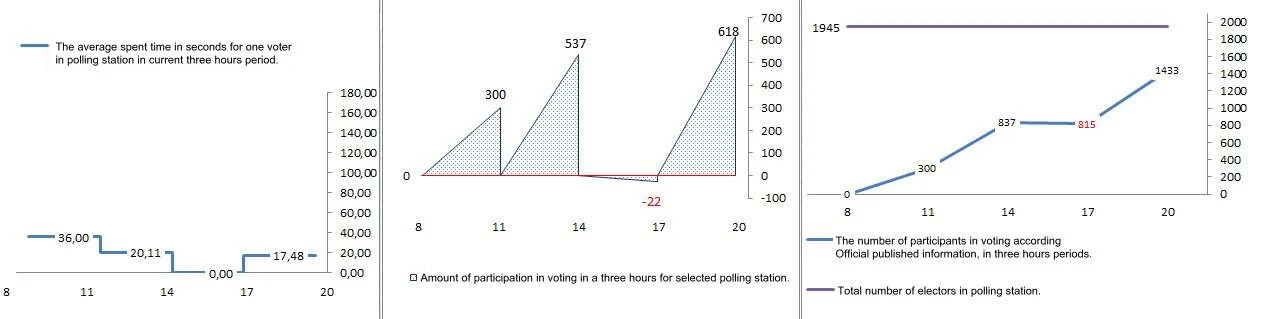
In Arabkir and Shengavit the count fell in the afternoon and then rose by 618–703 voters in three hours, one every 15–17 seconds.
Original page on electionscount.info: “Negative” participation, 2012On 6 May 2012 the official turnout of these polling stations went down between two reports, which cannot happen in a real count: each report includes everyone who voted since 8:00. The monitoring site drew a chart for each such station from the turnout published by elections.am. They are among the 20 stations with "negative" participation in 2012.
How to read these charts
The chart has three panels, all for the same polling station and the same four reporting times (11:00, 14:00, 17:00, 20:00):
- Left: the average number of seconds one voter spent at the station in each 3-hour window (10,800 seconds divided by the voters in that window). Low = fast; 0 = the count went down.
- Middle: how many people voted in each 3-hour window. A triangle below the red line is a negative number, an impossible decrease.
- Right: the cumulative turnout reported at each hour (blue) against the number of registered voters (purple line). Red labels mark the reports that broke the rules.
Station 04/03, Arabkir, Yerevan
School No. 77 named after R. Miroyan, 11 Adonts Street. Registered voters: 1,909.
How to read this chart
Left: seconds per voter in each 3-hour window. Middle: voters in each window (below the red line = a decrease). Right: reported turnout (blue) against the 1,909 registered voters (purple).
What it shows
Between 14:00 and 17:00 the count fell from 548 to 456, 92 people fewer. Then, in the last three hours, 703 people are said to have voted, one every 15.4 seconds, faster than even two registration tables can work. The station ended with 1,159 participants, 60.7% of its 1,909 voters.
| Window | Reported turnout at the end | Voters in the window | Seconds per voter |
|---|---|---|---|
| 8:00–11:00 | 170 | 170 | 63.5 |
| 11:00–14:00 | 548 | 378 | 28.6 |
| 14:00–17:00 | 456 | -92 | — |
| 17:00–20:00 | 1,159 | 703 | 15.4 |
Station 12/26, Shengavit, Yerevan
School No. 98, 97 Noragavit 1st Street. Registered voters: 1,945.
How to read this chart
Left: seconds per voter in each 3-hour window. Middle: voters in each window (below the red line = a decrease). Right: reported turnout (blue) against the 1,945 registered voters (purple).
What it shows
The count dipped by 22 between 14:00 and 17:00 (837 to 815) and then rose by 618 in the last three hours, one voter every 17.5 seconds. Earlier, between 11:00 and 14:00, 537 people voted in three hours, one every 20 seconds.
| Window | Reported turnout at the end | Voters in the window | Seconds per voter |
|---|---|---|---|
| 8:00–11:00 | 300 | 300 | 36.0 |
| 11:00–14:00 | 837 | 537 | 20.1 |
| 14:00–17:00 | 815 | -22 | — |
| 17:00–20:00 | 1,433 | 618 | 17.5 |
Why it matters
A report that falls means that at least one of the station's official numbers is false: either voters were announced who had not come, or the final protocol was cut back. When the fall is followed by hundreds of votes at a speed of 10–20 seconds per voter, or when a report exceeds the number of registered voters, the numbers point to signatures and ballots added on paper. See polling station capacity and the method of comparing election numbers.
Data and sources on this site
From the book
This article is based on Chapters IV and VI of Electoral Rights and Election Falsification by Lyudvig Khachatryan, which explains the full method, the formulas and the cases behind it.