electionscount.info › Analysis
Election analysis
Charts and data from the electronic monitoring of Armenian elections, explained in English, with the methods from the book Electoral Rights and Election Falsification.
The method
- How to Check an Election with Its Own Numbers: The Method of Comparing Election NumbersAn honest polling station leaves behind a set of numbers that must agree with each other. When they do not, something happened that the law does not allow.
- Polling Station Capacity: How Fast Can People Really Vote?Every polling station has a speed limit. When official turnout is higher than that limit, the votes could not have been cast the way the protocol says.
- Ballot Stuffing: The Traces It Leaves in Election NumbersExtra ballots in a box are hard to hide, because they have to match signatures, envelopes and turnout. Each way of hiding them leaves its own trace.
- Voting on Behalf of Others: What Voter Lists RevealThe quietest way to add votes is not to stuff a box but to change who is on the list. Voter-list numbers, compared over time, show it.
Comparisons across elections
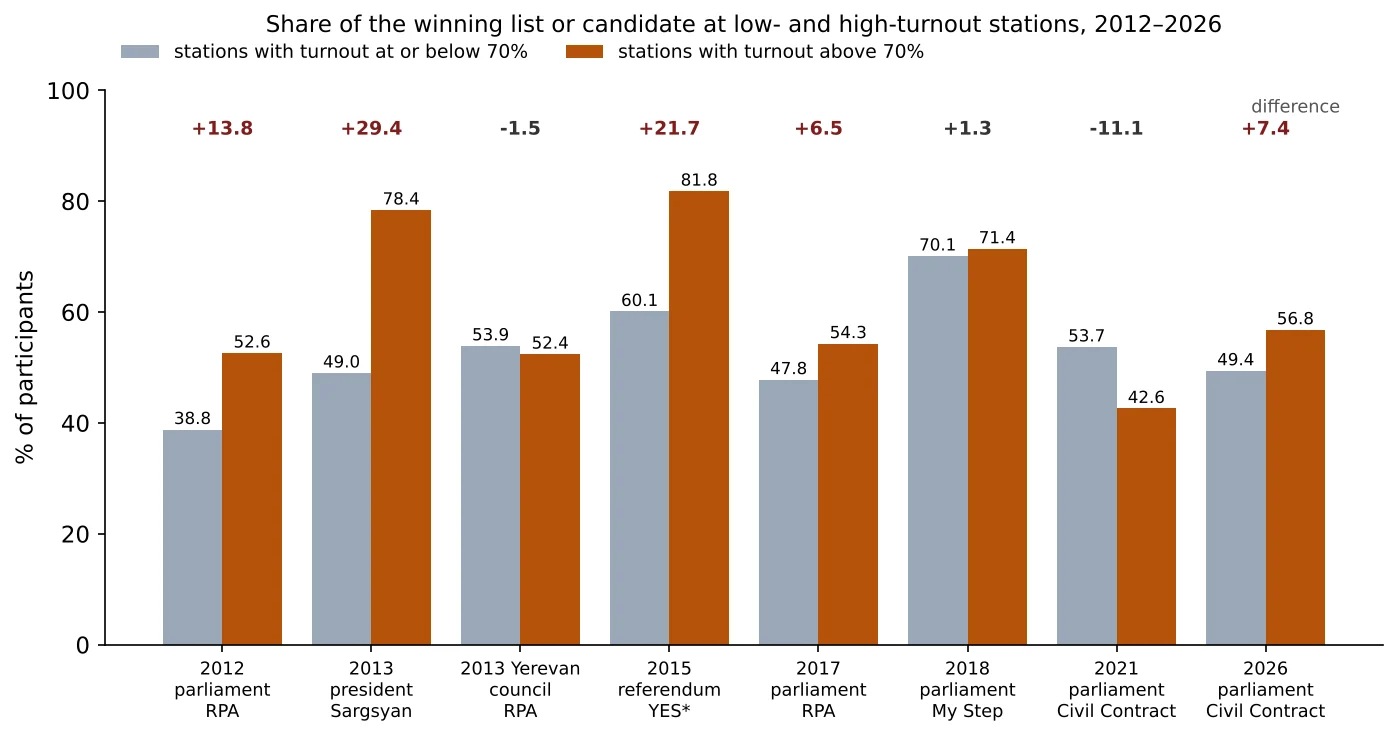 Armenian Elections 2012–2026 Compared: How the Winner’s Vote Changes With Turnout
Turnout and voting speed at every polling station, 2017–2021
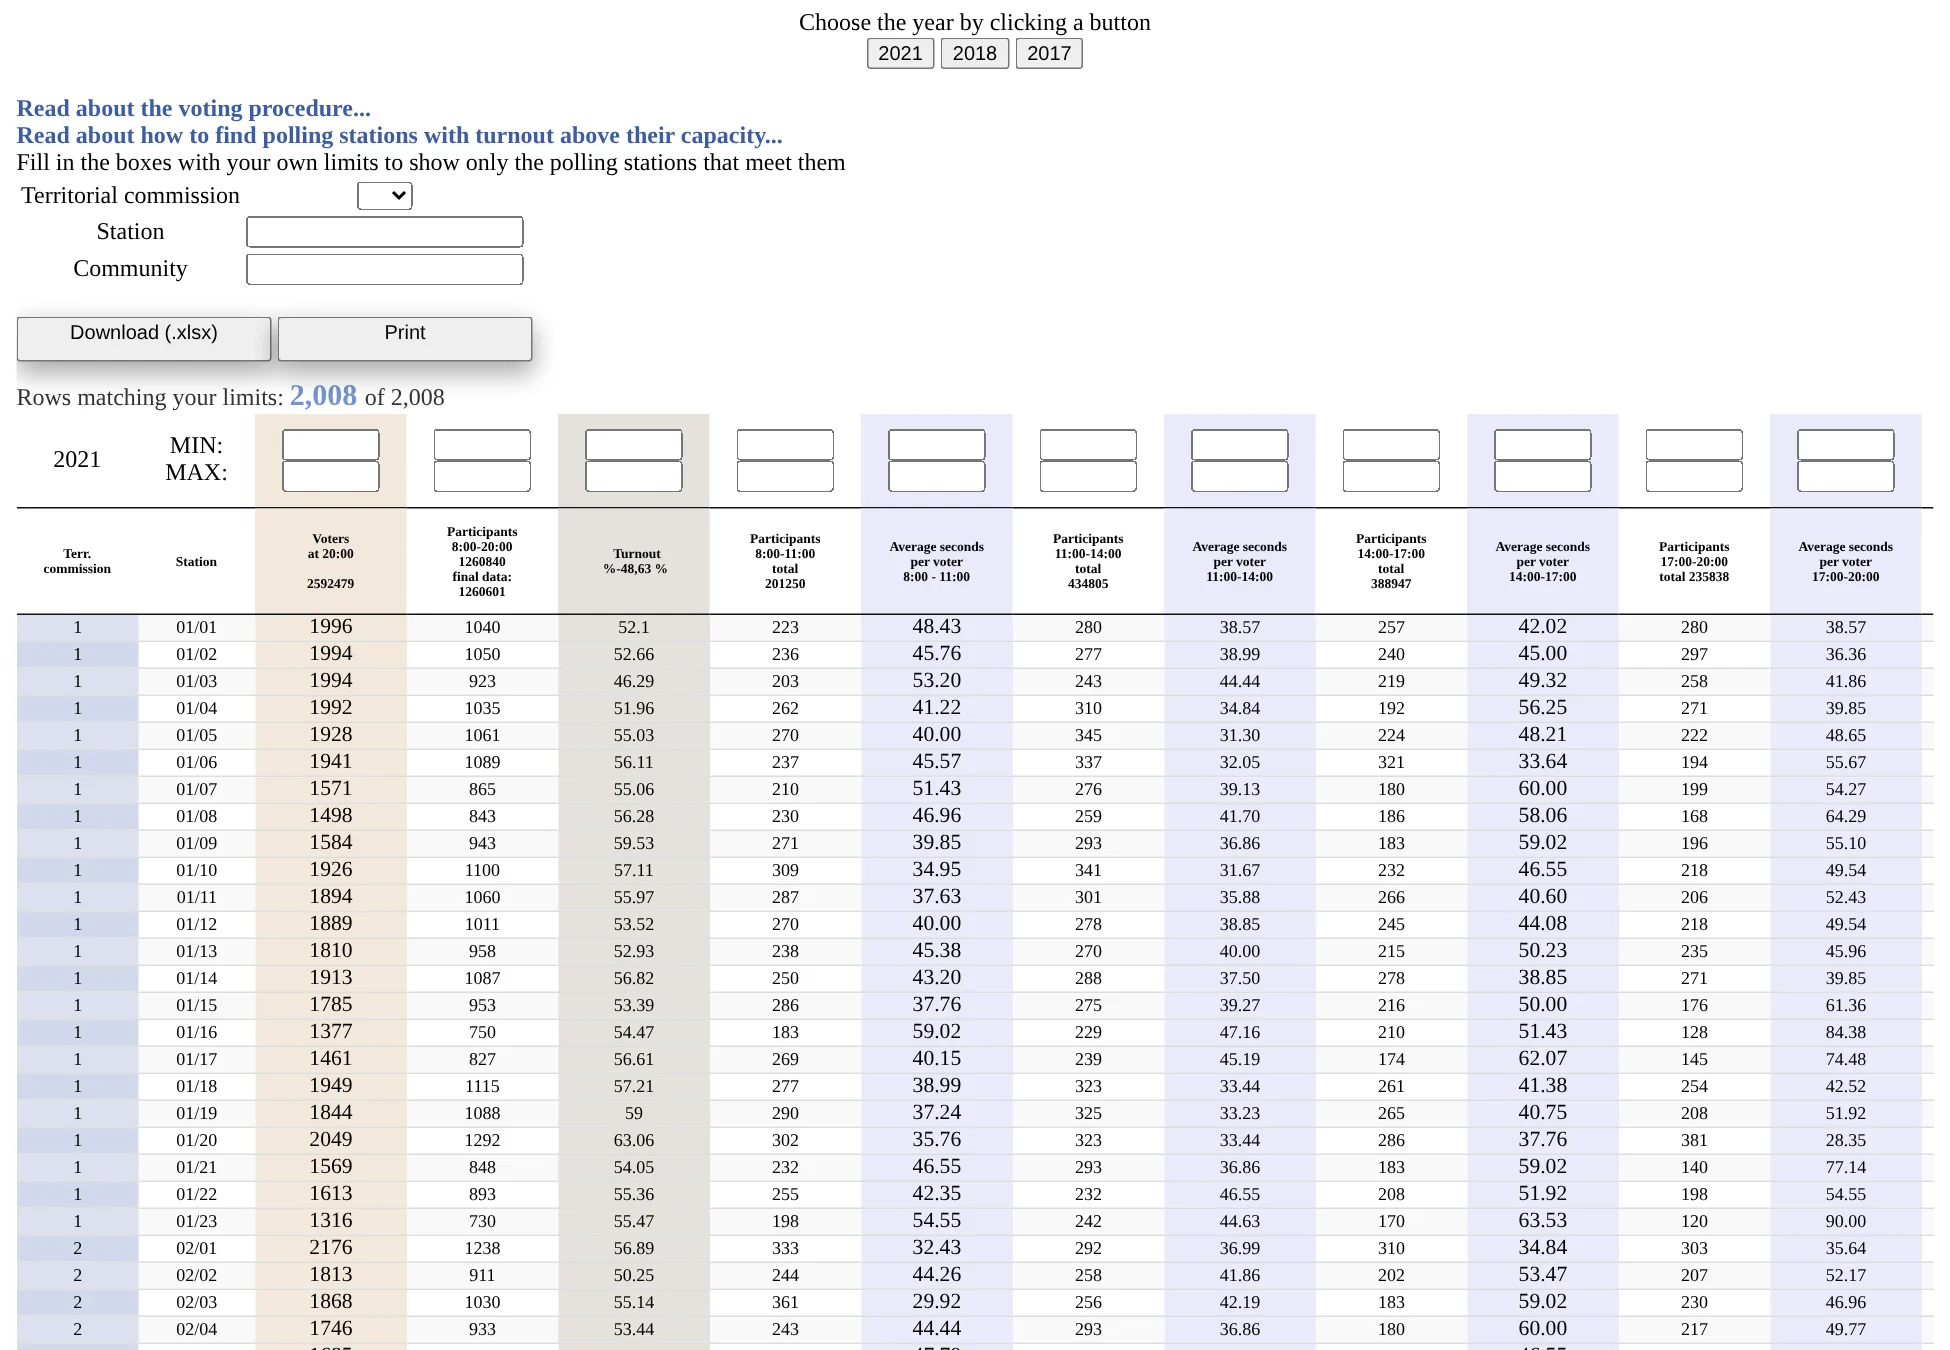 Turnout and Voting Speed at Every Polling Station, 2017–2021: How to Use the TableOne table, three elections, 2,000 polling stations: how many people voted in each 3-hour window and how fast that was. Here is how to read it and check it yourself.With charts explained: 1 charts
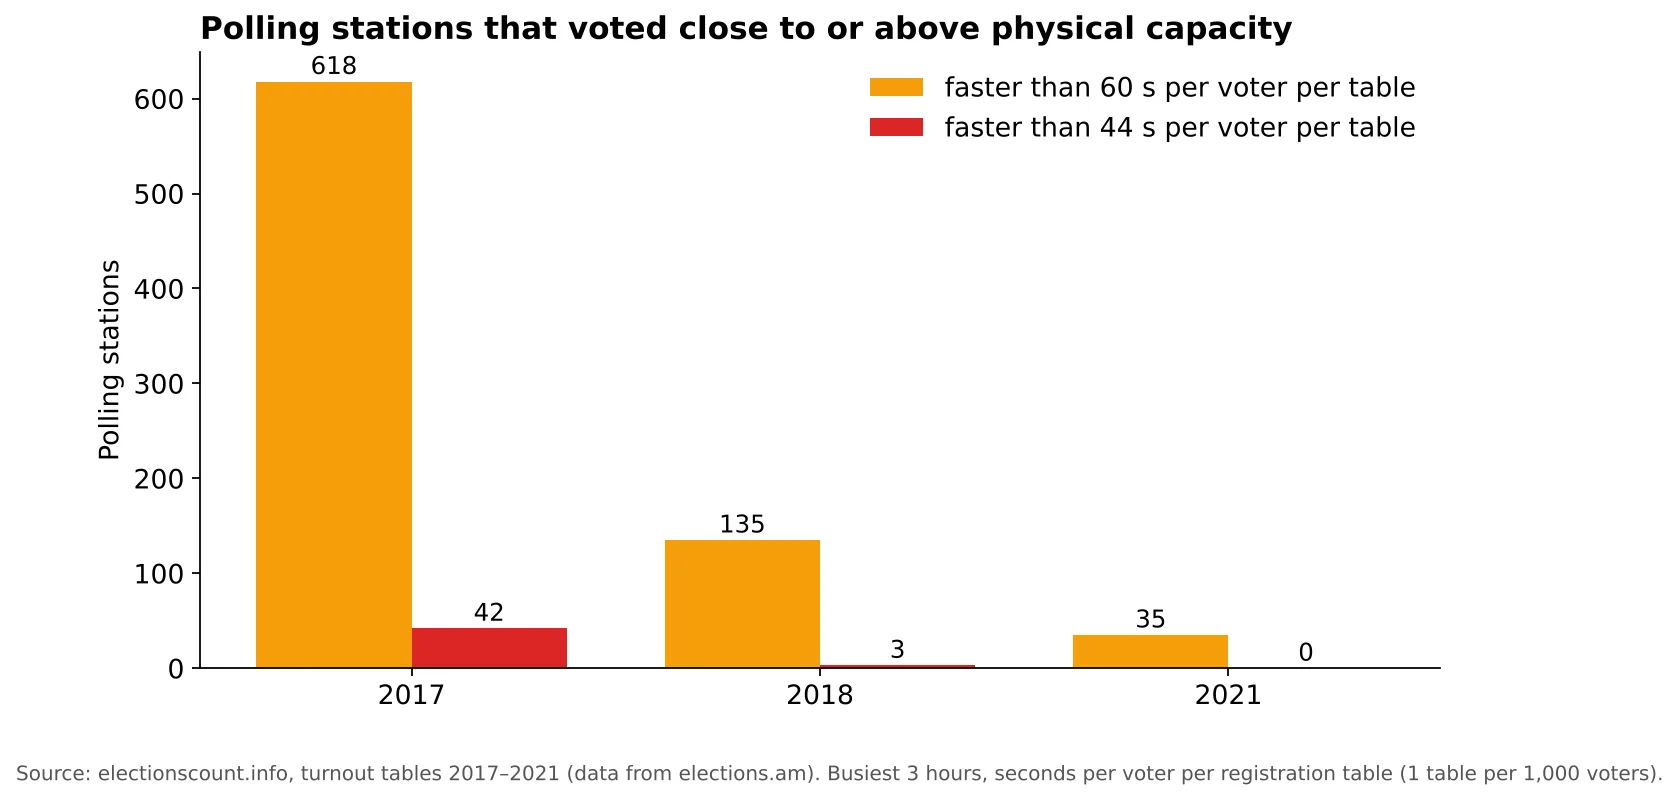 2017, 2018 and 2021 Compared: When Armenians Voted and How FastFrom 2017 to 2021 the number of polling stations voting faster than physically possible fell from 42 to 3 to none.With charts explained: 2 charts
- Polling Stations Where the Turnout Count Went Down, 2017–2021Turnout can only grow during election day. At nine polling stations the official reports say it fell.
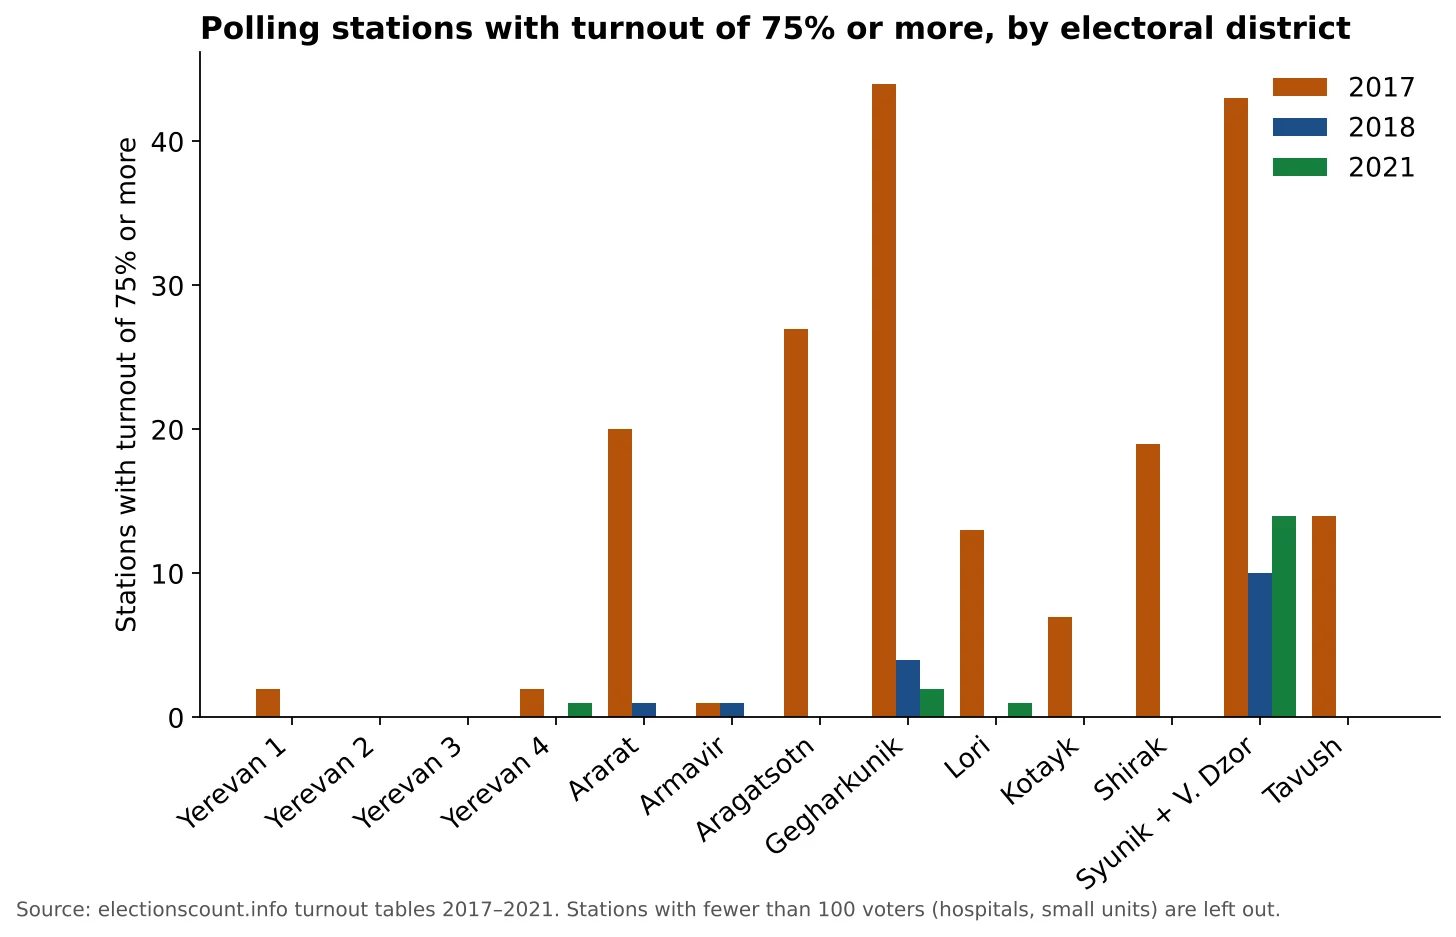 The Highest-Turnout Polling Stations in Armenia, 2017–2021In 2017, 192 polling stations reported turnout of 75% or more. In 2018 only 16 did, and in 2021, 18. Most of them are in Syunik and Gegharkunik.With charts explained: 1 charts
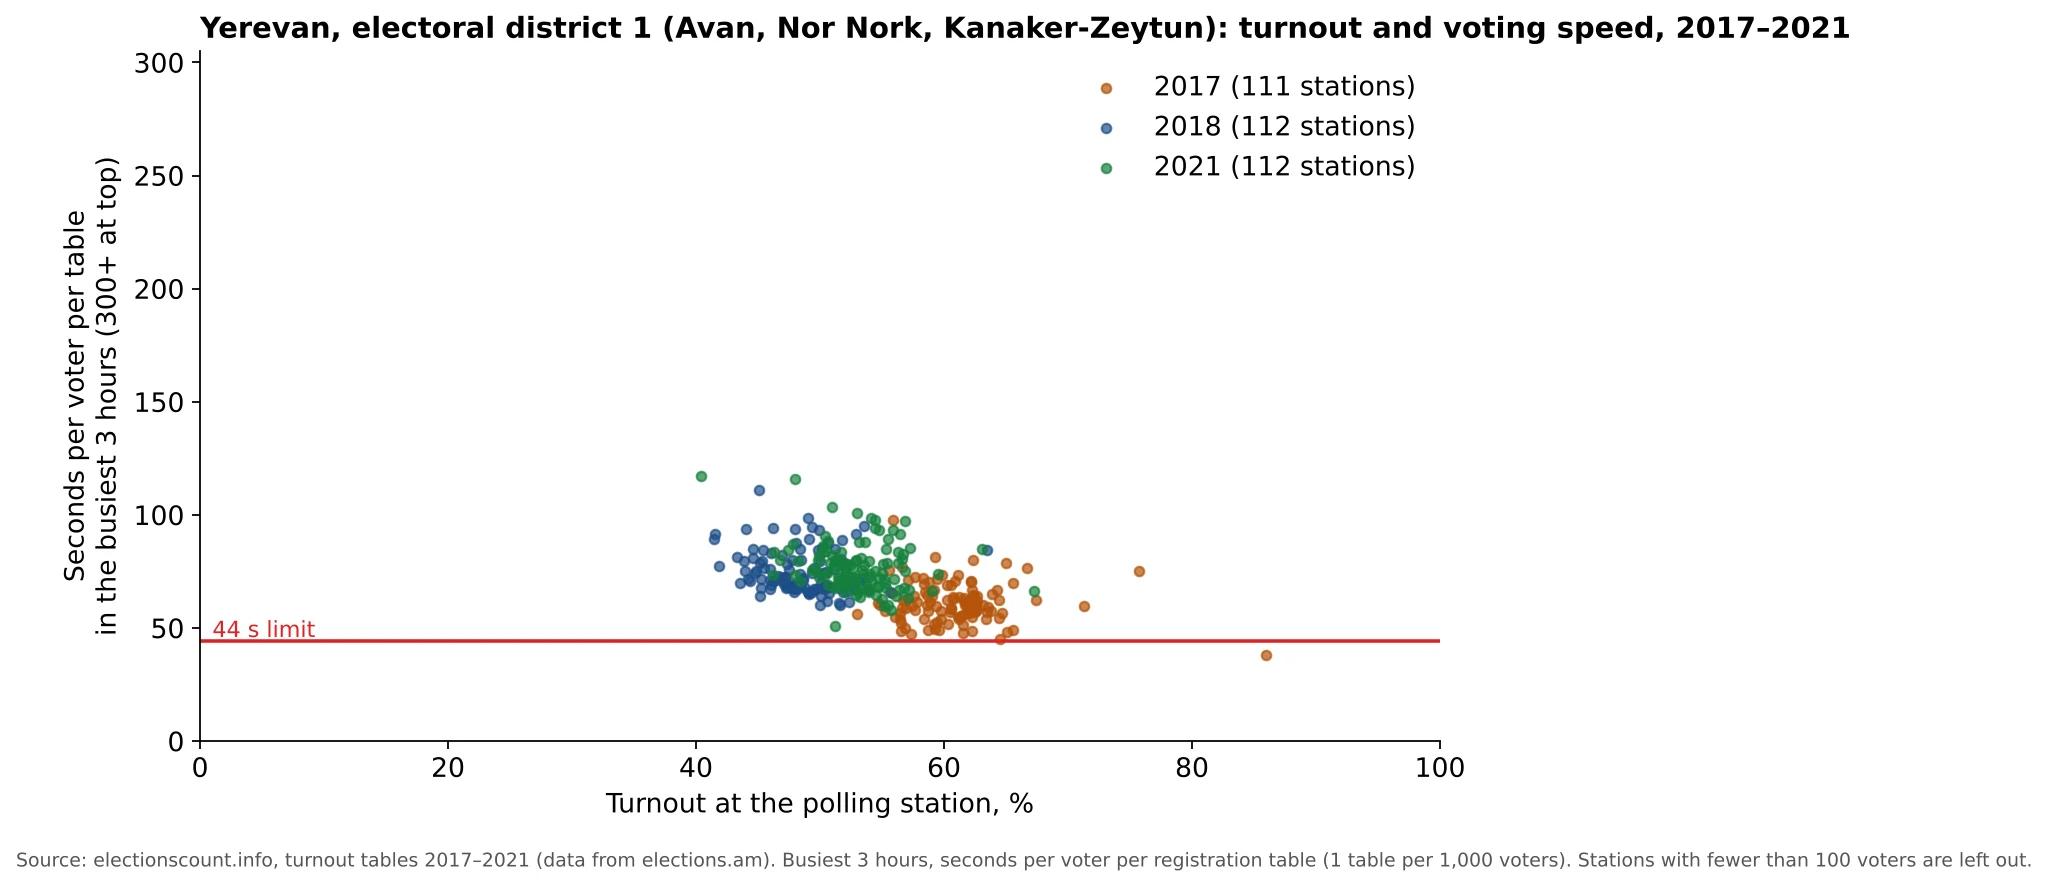 Yerevan Electoral District 1: Turnout and Voting Speed at Every Polling Station, 2017–2021Yerevan Electoral District 1: turnout 60.69% in 2017, 48.43% in 2018 and 52.94% in 2021; 1, 0 and 0 stations above physical capacity.With charts explained: 1 charts
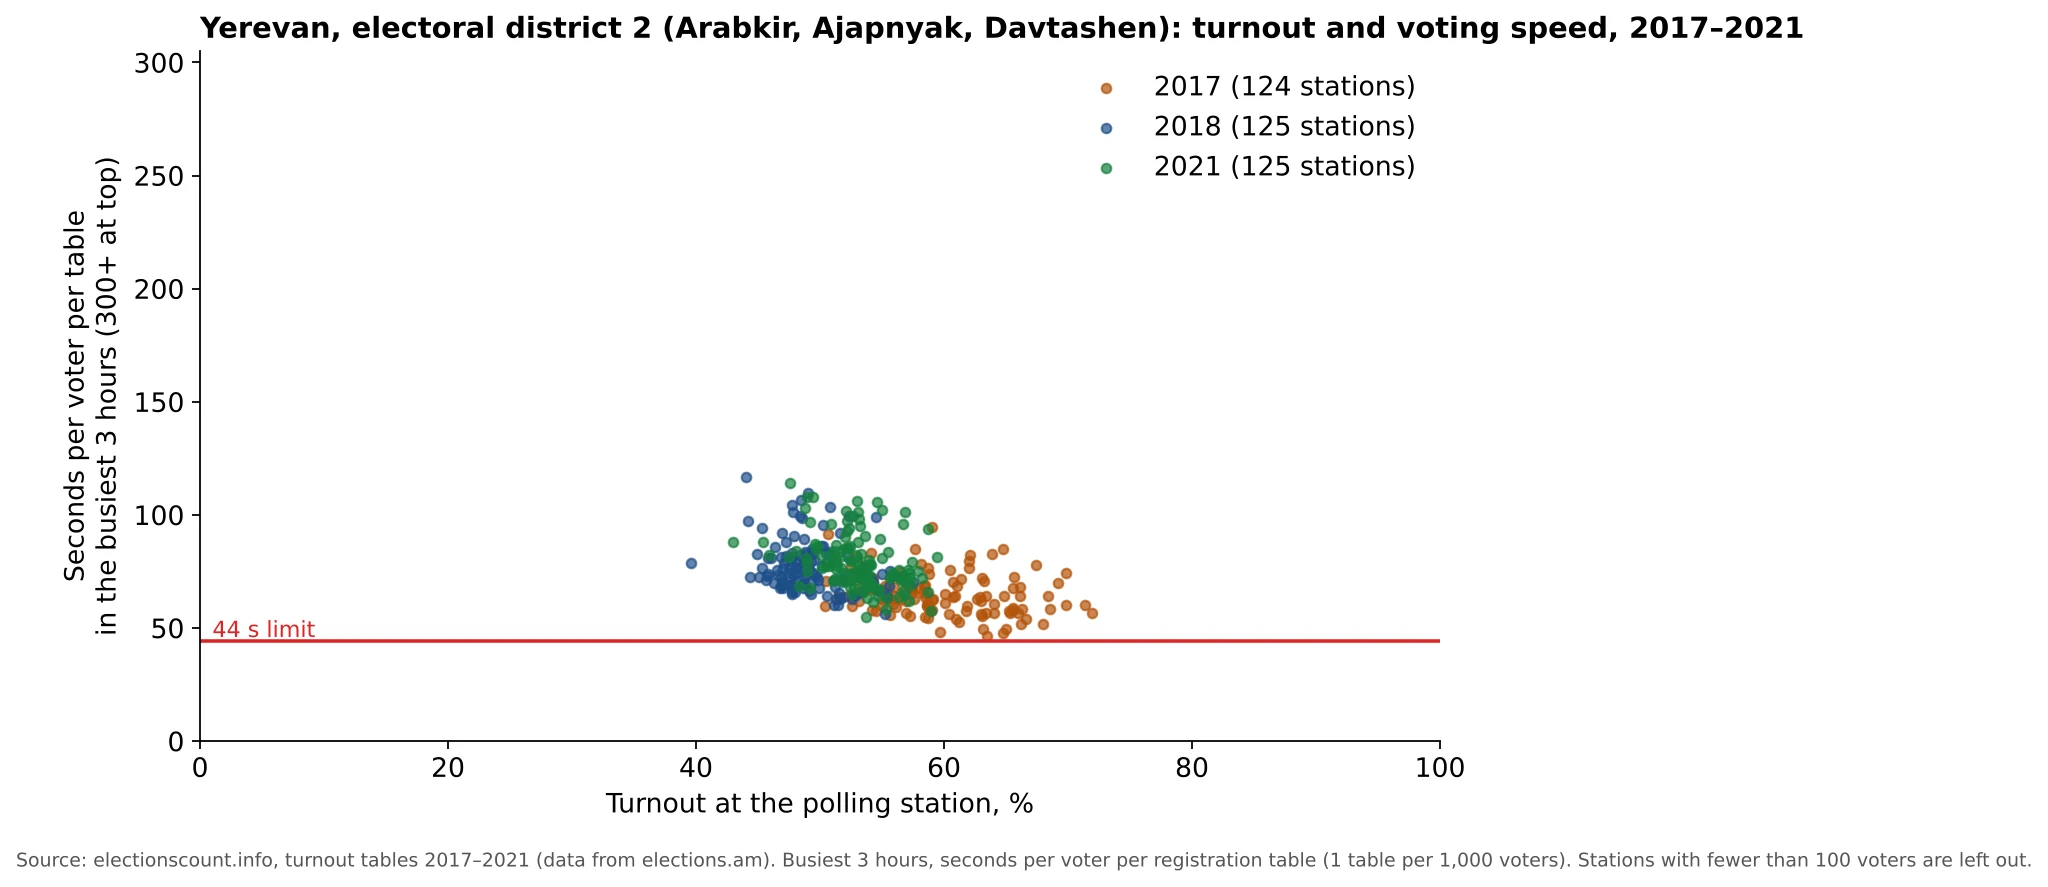 Yerevan Electoral District 2: Turnout and Voting Speed at Every Polling Station, 2017–2021Yerevan Electoral District 2: turnout 59.51% in 2017, 49.27% in 2018 and 53.04% in 2021; 0, 0 and 0 stations above physical capacity.With charts explained: 1 charts
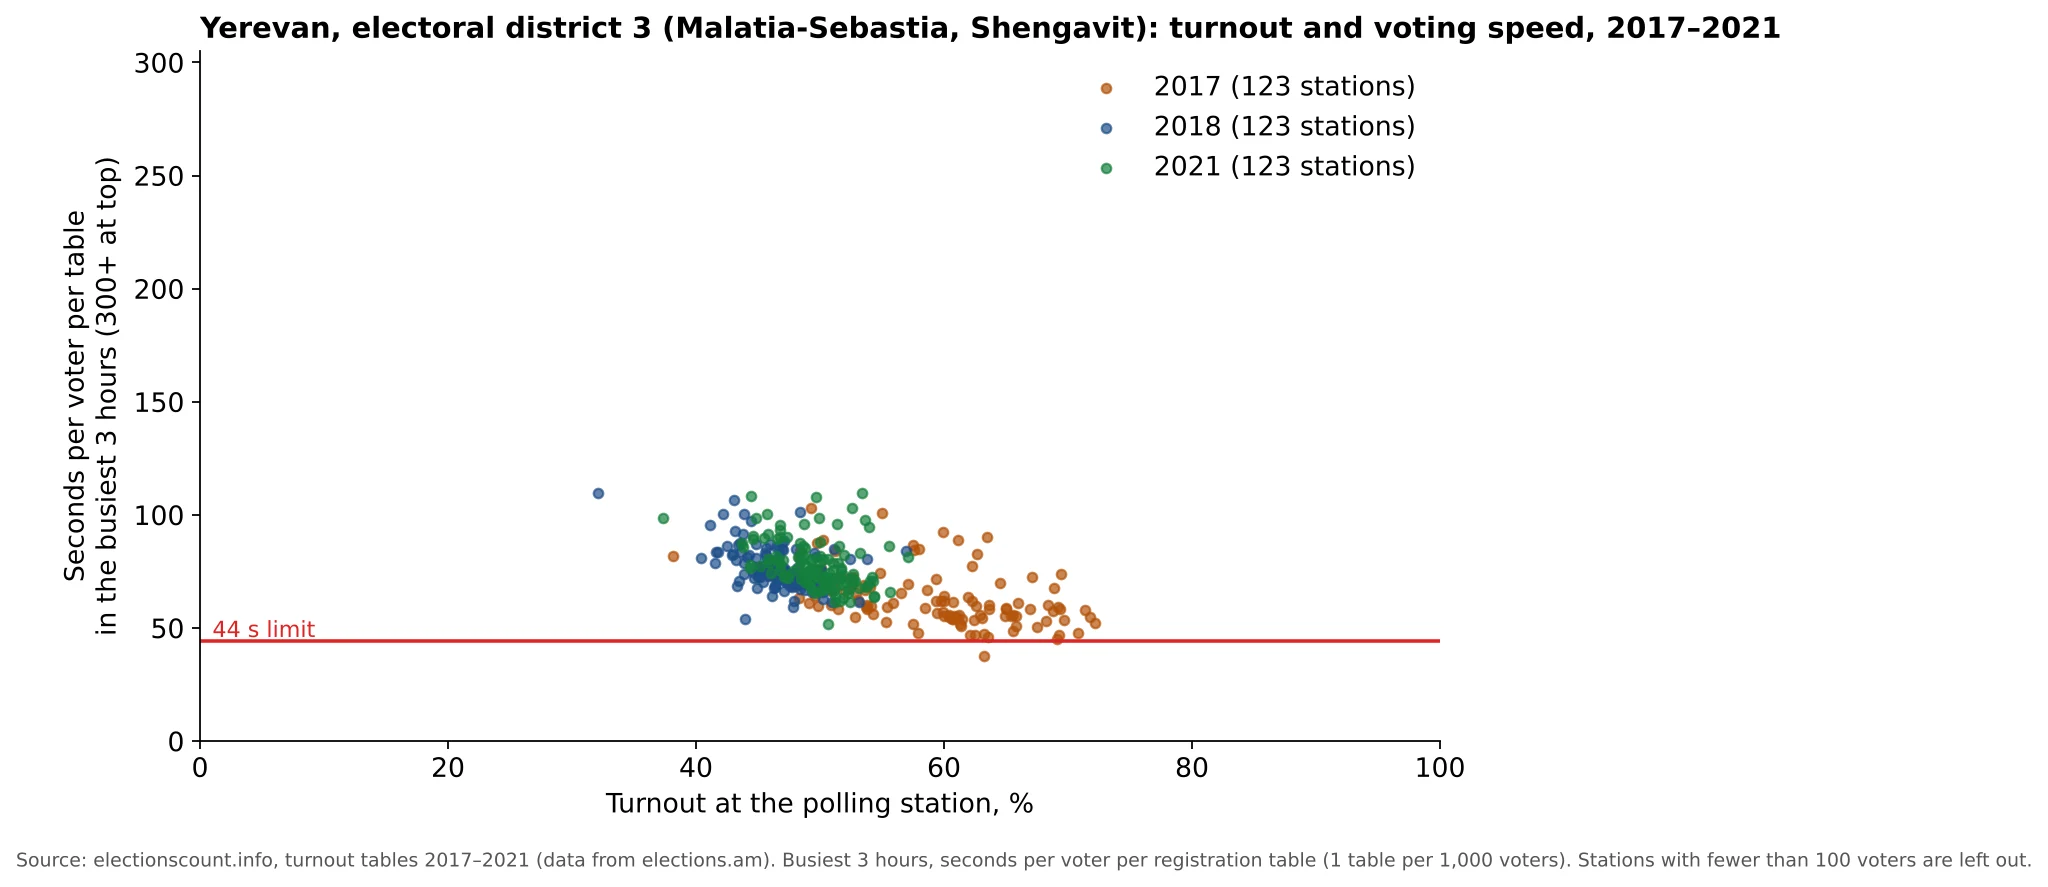 Yerevan Electoral District 3: Turnout and Voting Speed at Every Polling Station, 2017–2021Yerevan Electoral District 3: turnout 58.34% in 2017, 46.46% in 2018 and 49.63% in 2021; 1, 0 and 0 stations above physical capacity.With charts explained: 1 charts
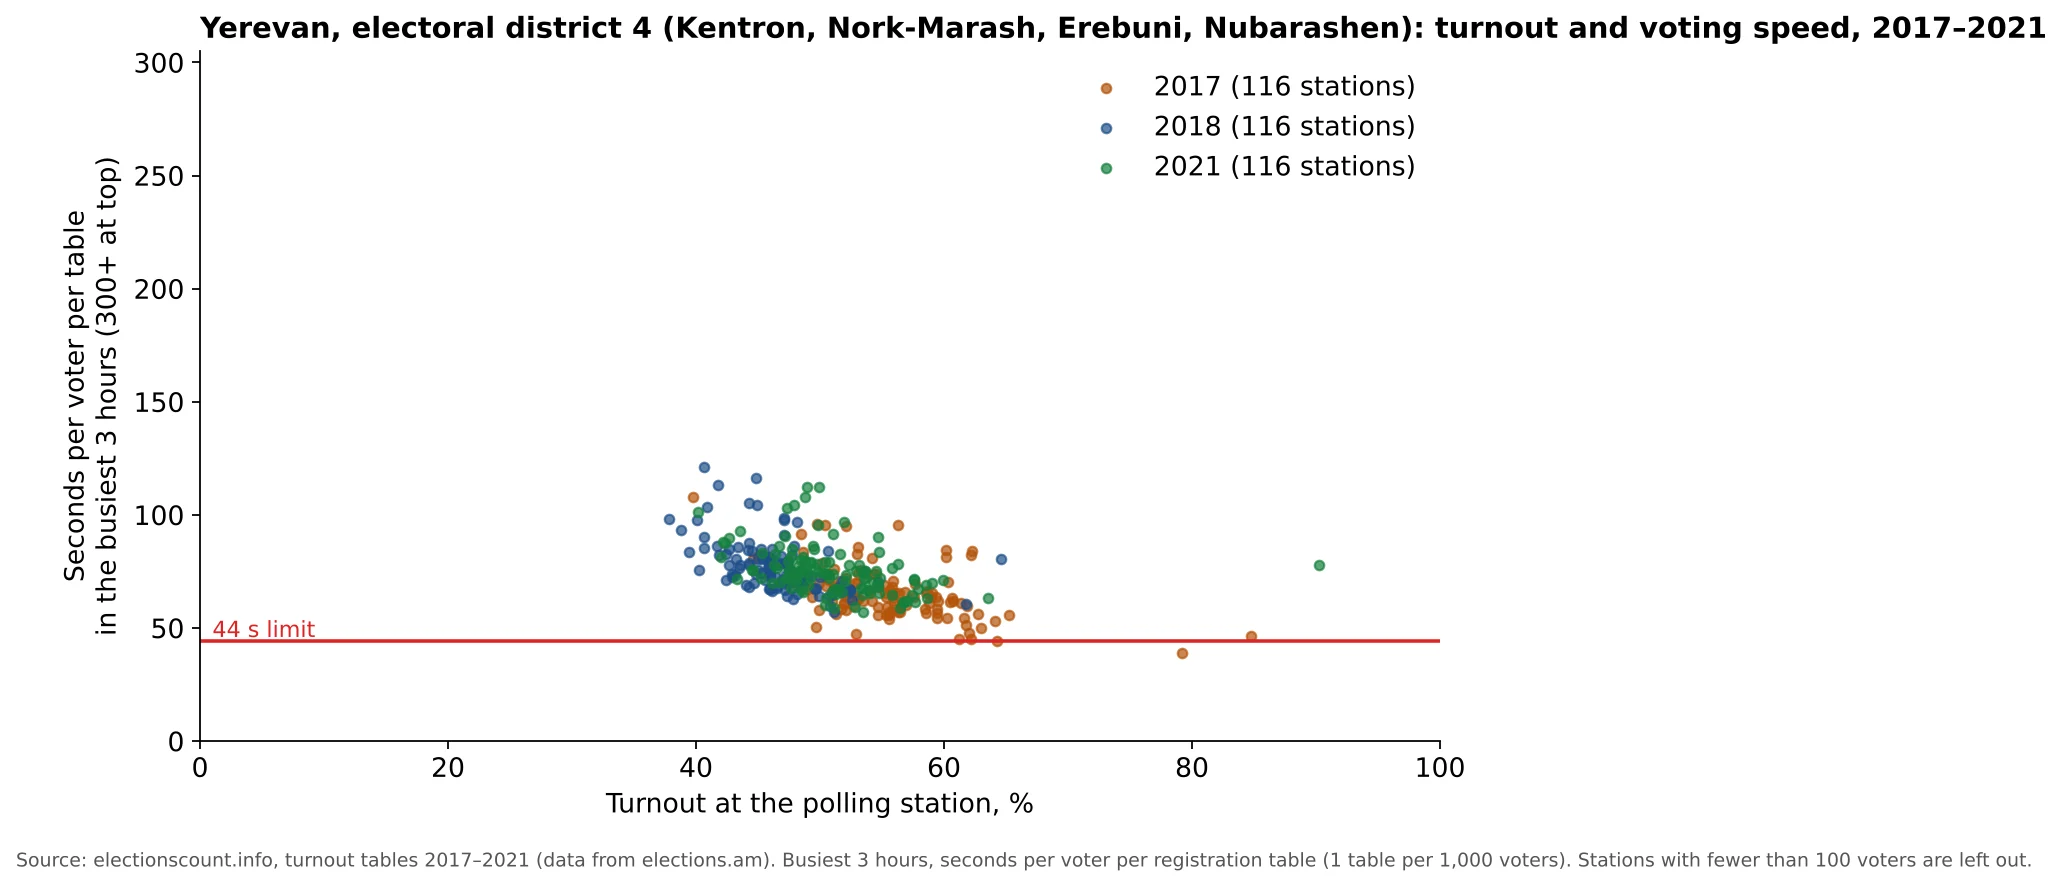 Yerevan Electoral District 4: Turnout and Voting Speed at Every Polling Station, 2017–2021Yerevan Electoral District 4: turnout 55.37% in 2017, 46.35% in 2018 and 50.76% in 2021; 1, 0 and 0 stations above physical capacity.With charts explained: 1 charts
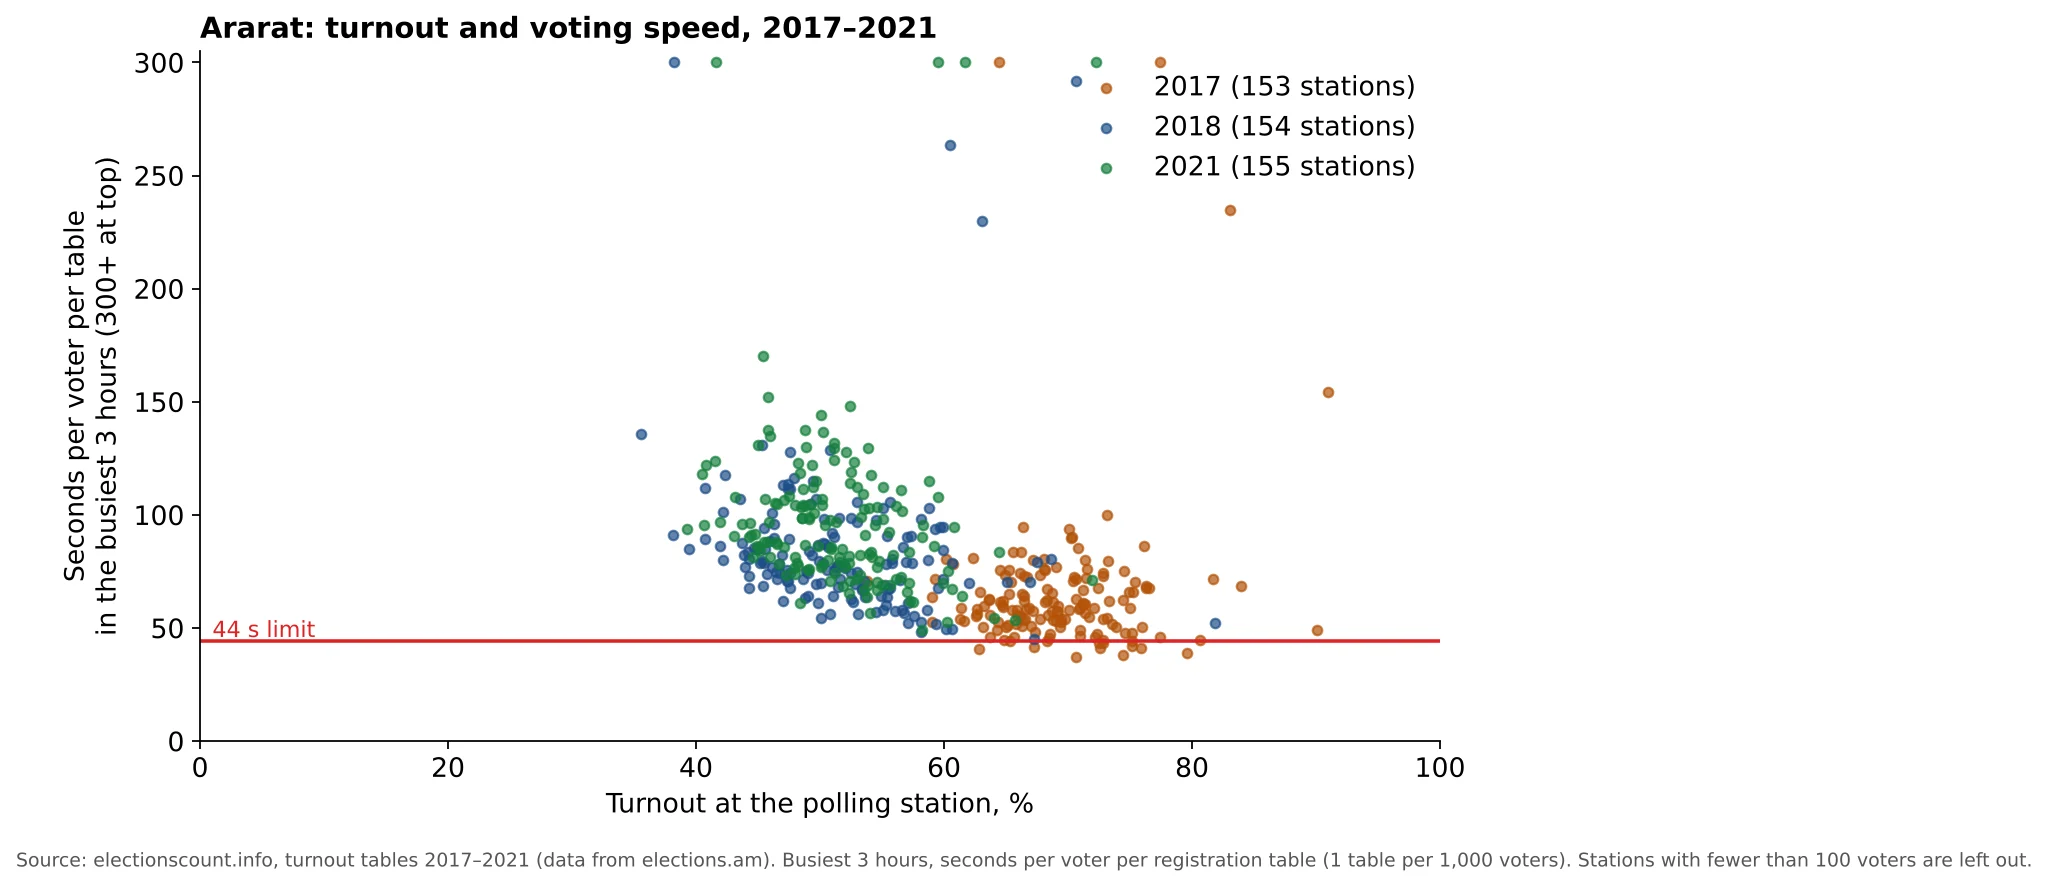 Ararat Province: Turnout and Voting Speed at Every Polling Station, 2017–2021Ararat Province: turnout 68.45% in 2017, 50.64% in 2018 and 50.87% in 2021; 10, 0 and 0 stations above physical capacity.With charts explained: 1 charts
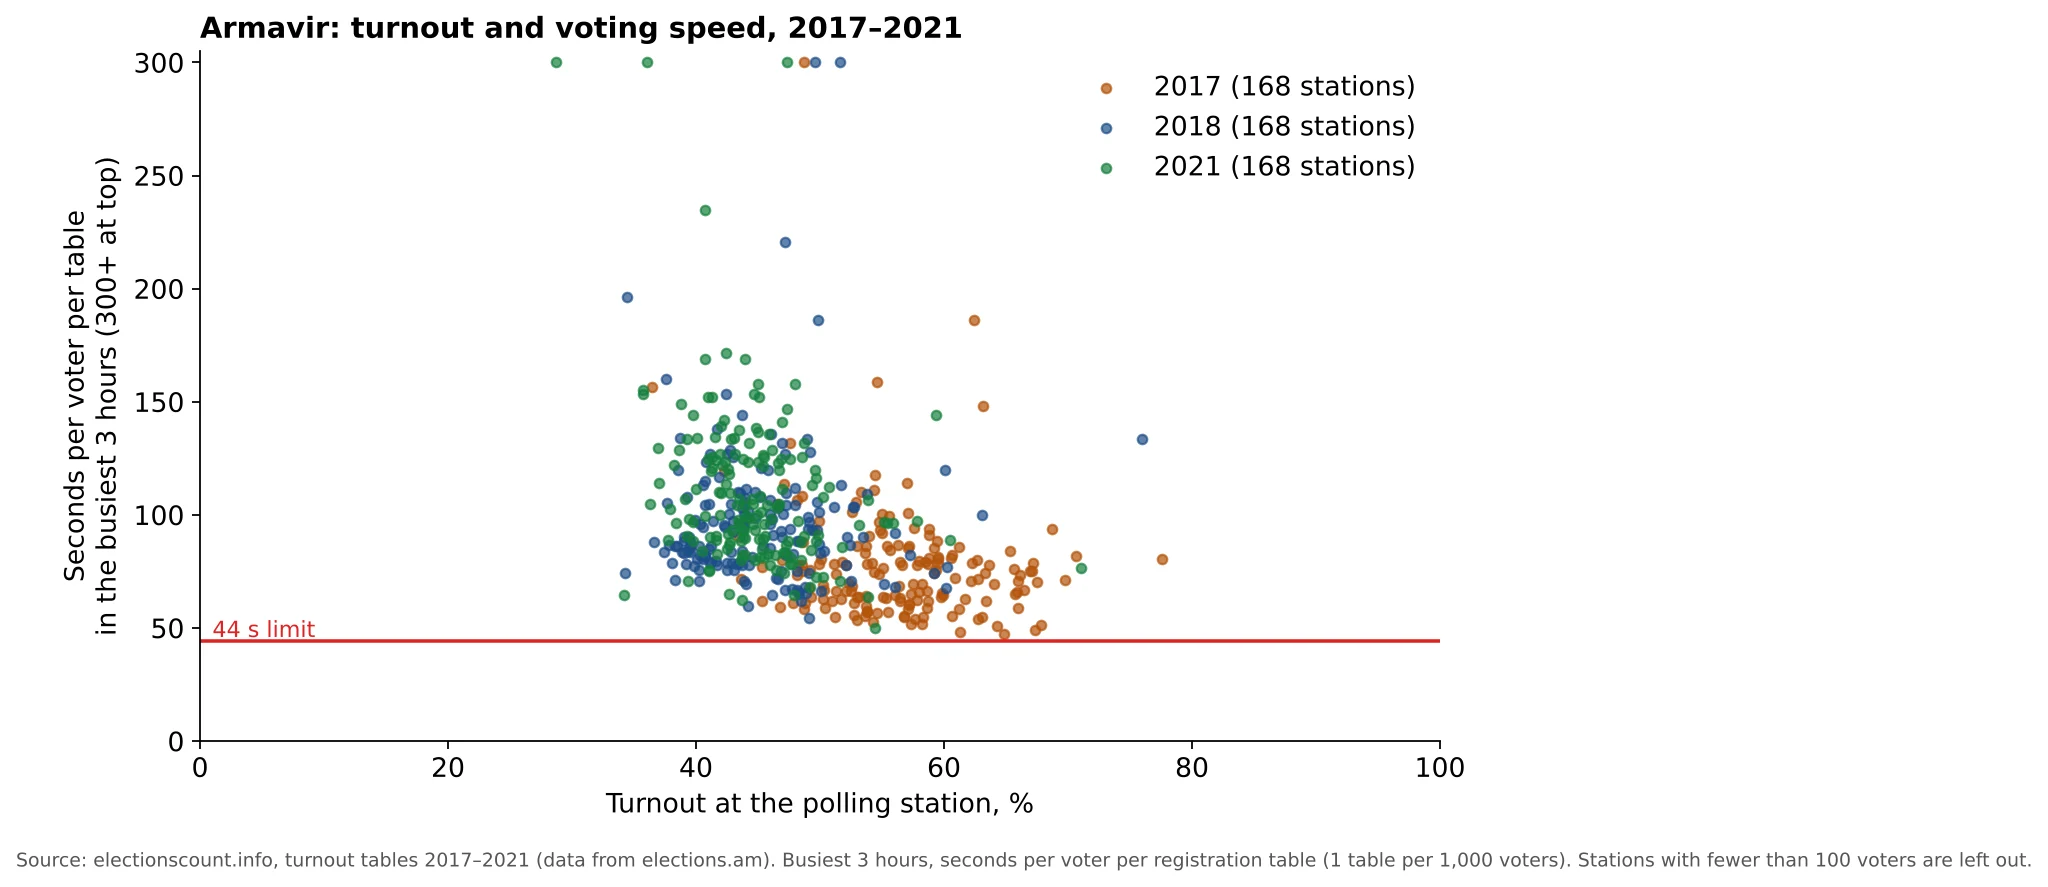 Armavir Province: Turnout and Voting Speed at Every Polling Station, 2017–2021Armavir Province: turnout 55.53% in 2017, 44.35% in 2018 and 44.47% in 2021; 0, 0 and 0 stations above physical capacity.With charts explained: 1 charts
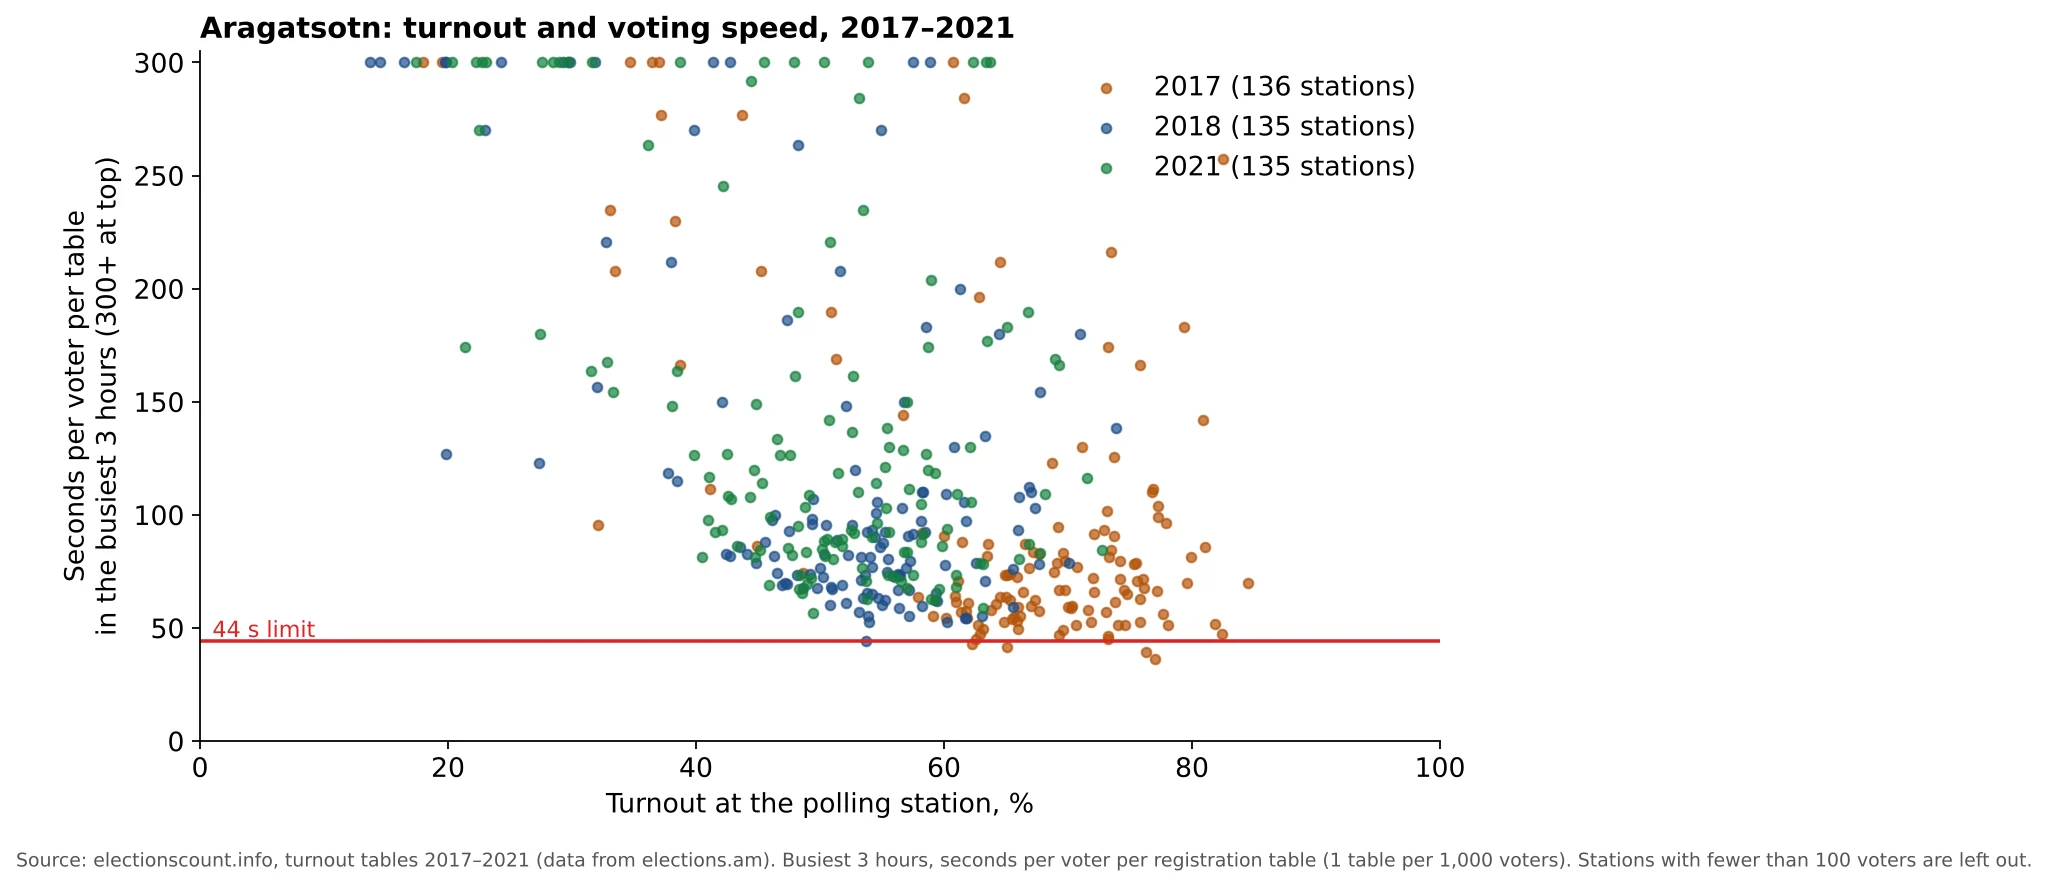 Aragatsotn Province: Turnout and Voting Speed at Every Polling Station, 2017–2021Aragatsotn Province: turnout 66.55% in 2017, 52.1% in 2018 and 50.0% in 2021; 4, 0 and 0 stations above physical capacity.With charts explained: 1 charts
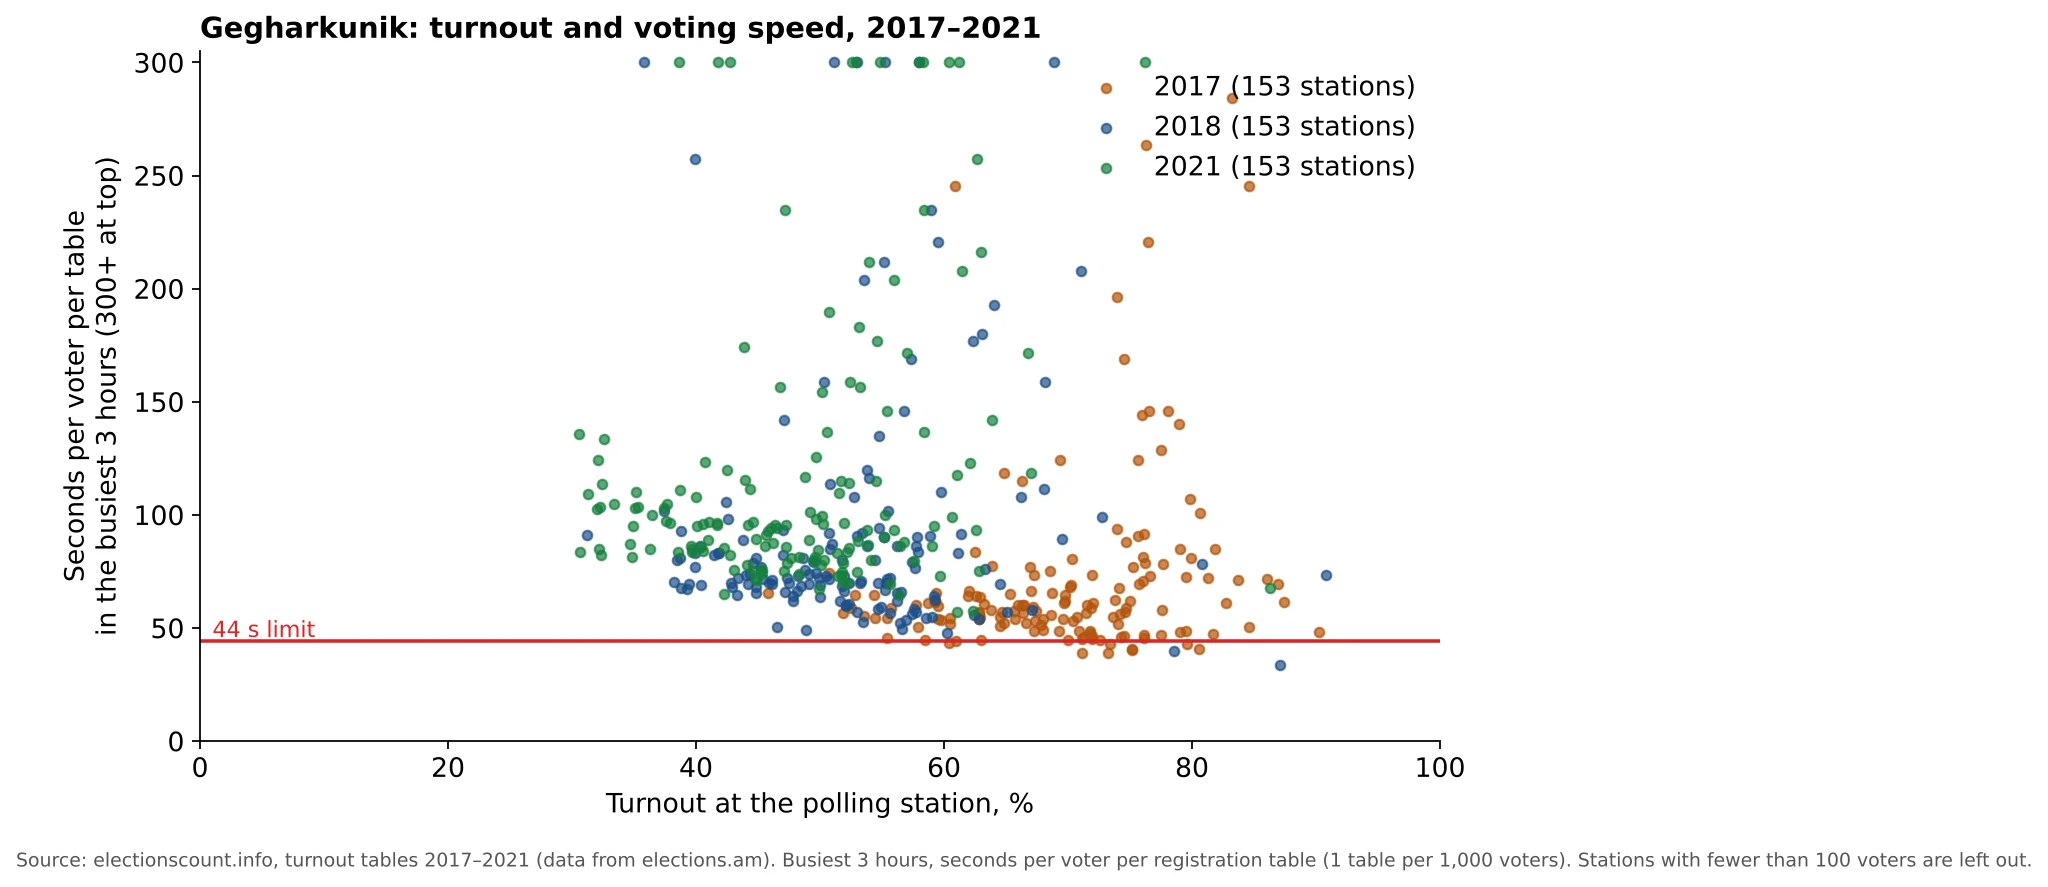 Gegharkunik Province: Turnout and Voting Speed at Every Polling Station, 2017–2021Gegharkunik Province: turnout 67.0% in 2017, 50.45% in 2018 and 45.47% in 2021; 8, 2 and 0 stations above physical capacity.With charts explained: 1 charts
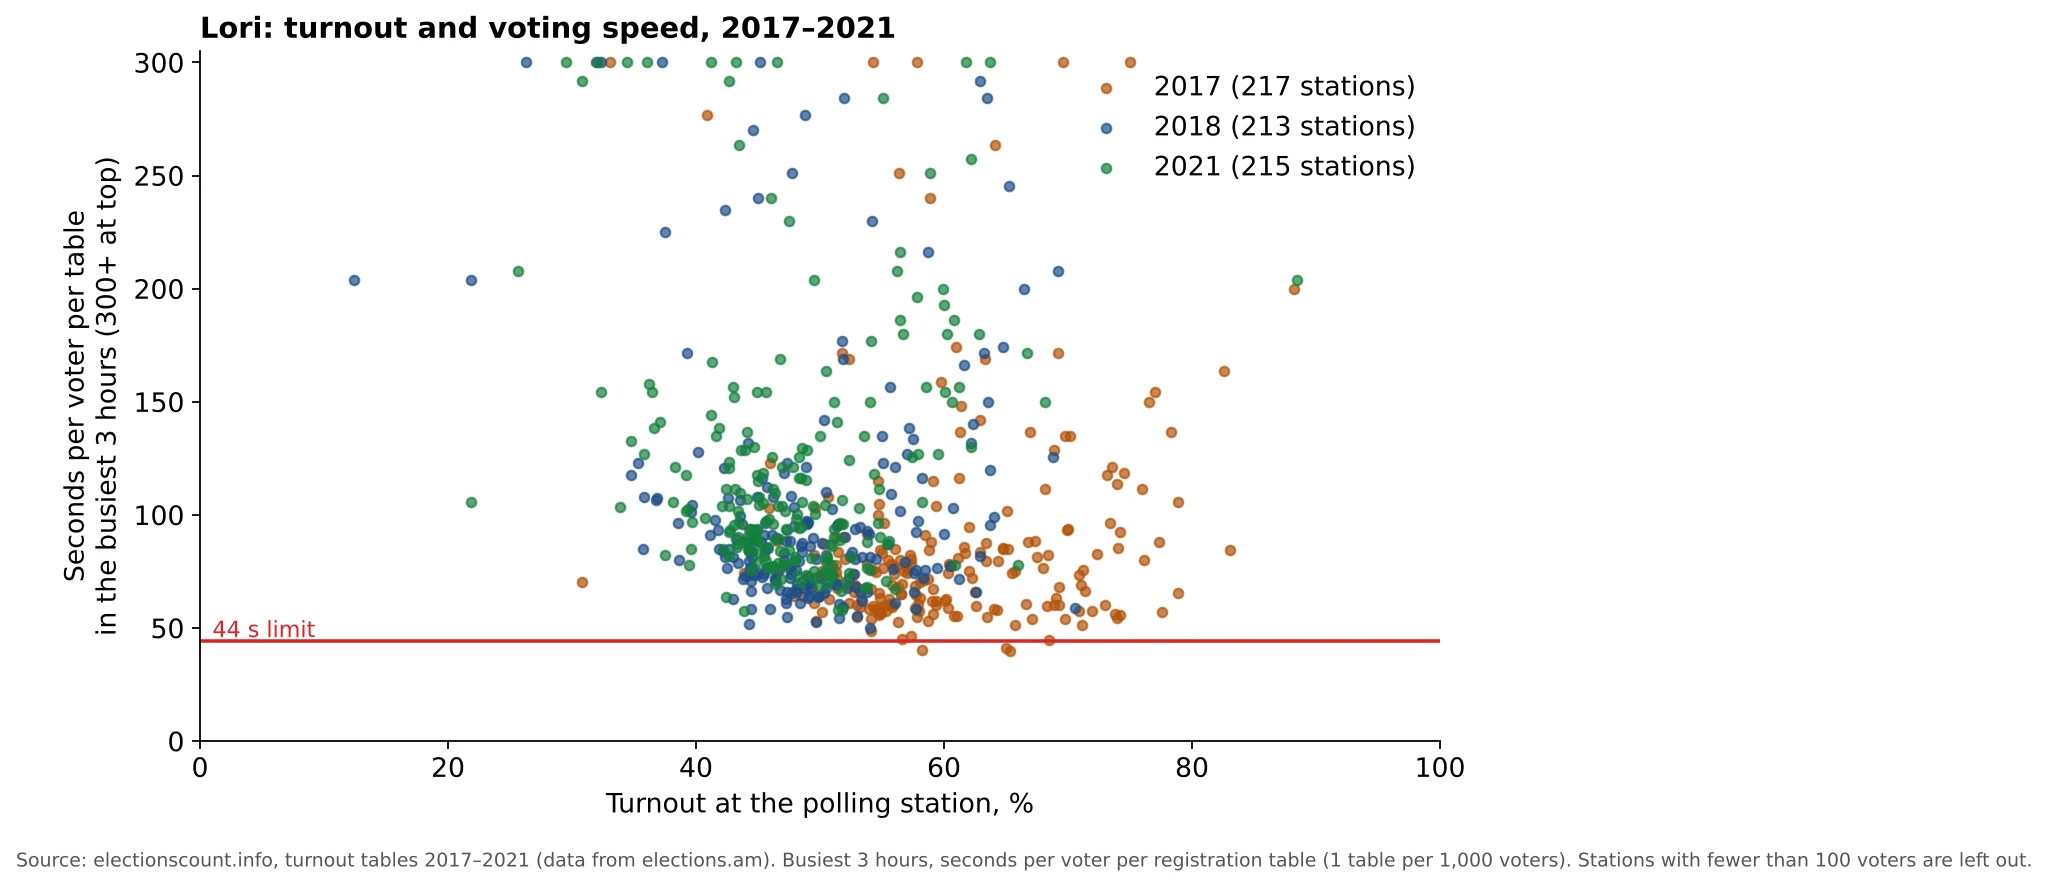 Lori Province: Turnout and Voting Speed at Every Polling Station, 2017–2021Lori Province: turnout 57.96% in 2017, 47.64% in 2018 and 46.73% in 2021; 3, 0 and 0 stations above physical capacity.With charts explained: 1 charts
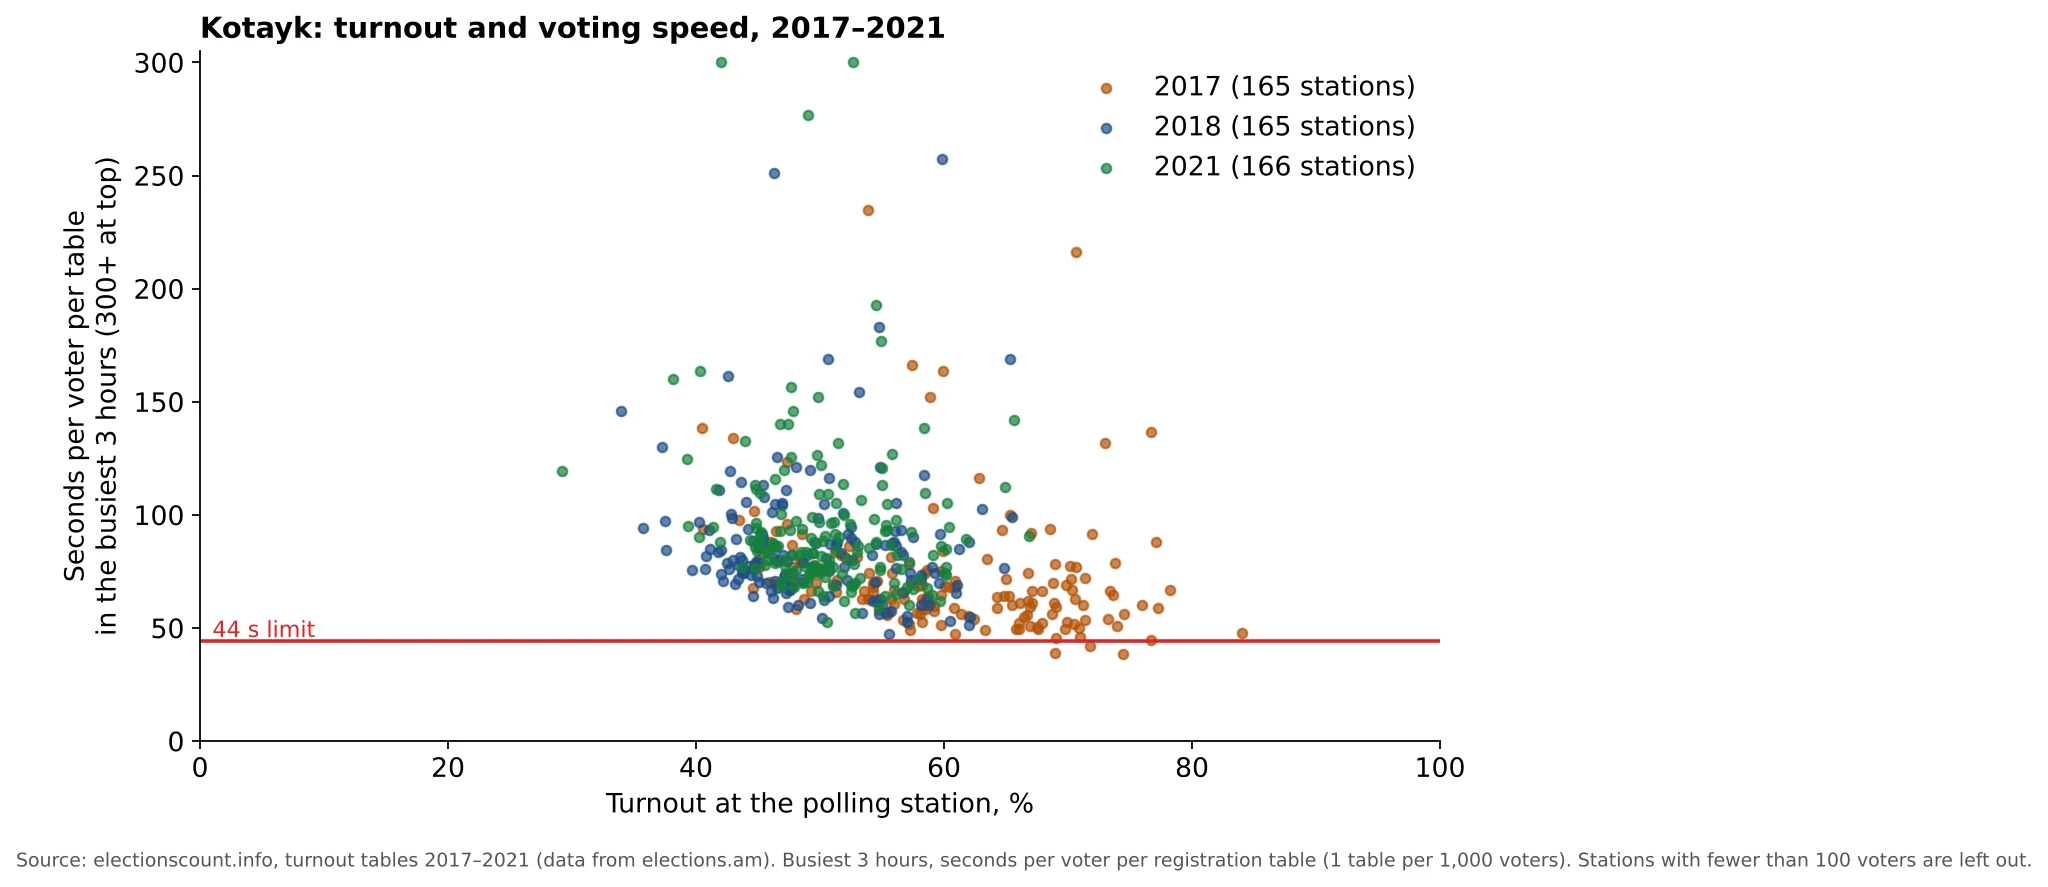 Kotayk Province: Turnout and Voting Speed at Every Polling Station, 2017–2021Kotayk Province: turnout 59.04% in 2017, 48.92% in 2018 and 50.08% in 2021; 3, 0 and 0 stations above physical capacity.With charts explained: 1 charts
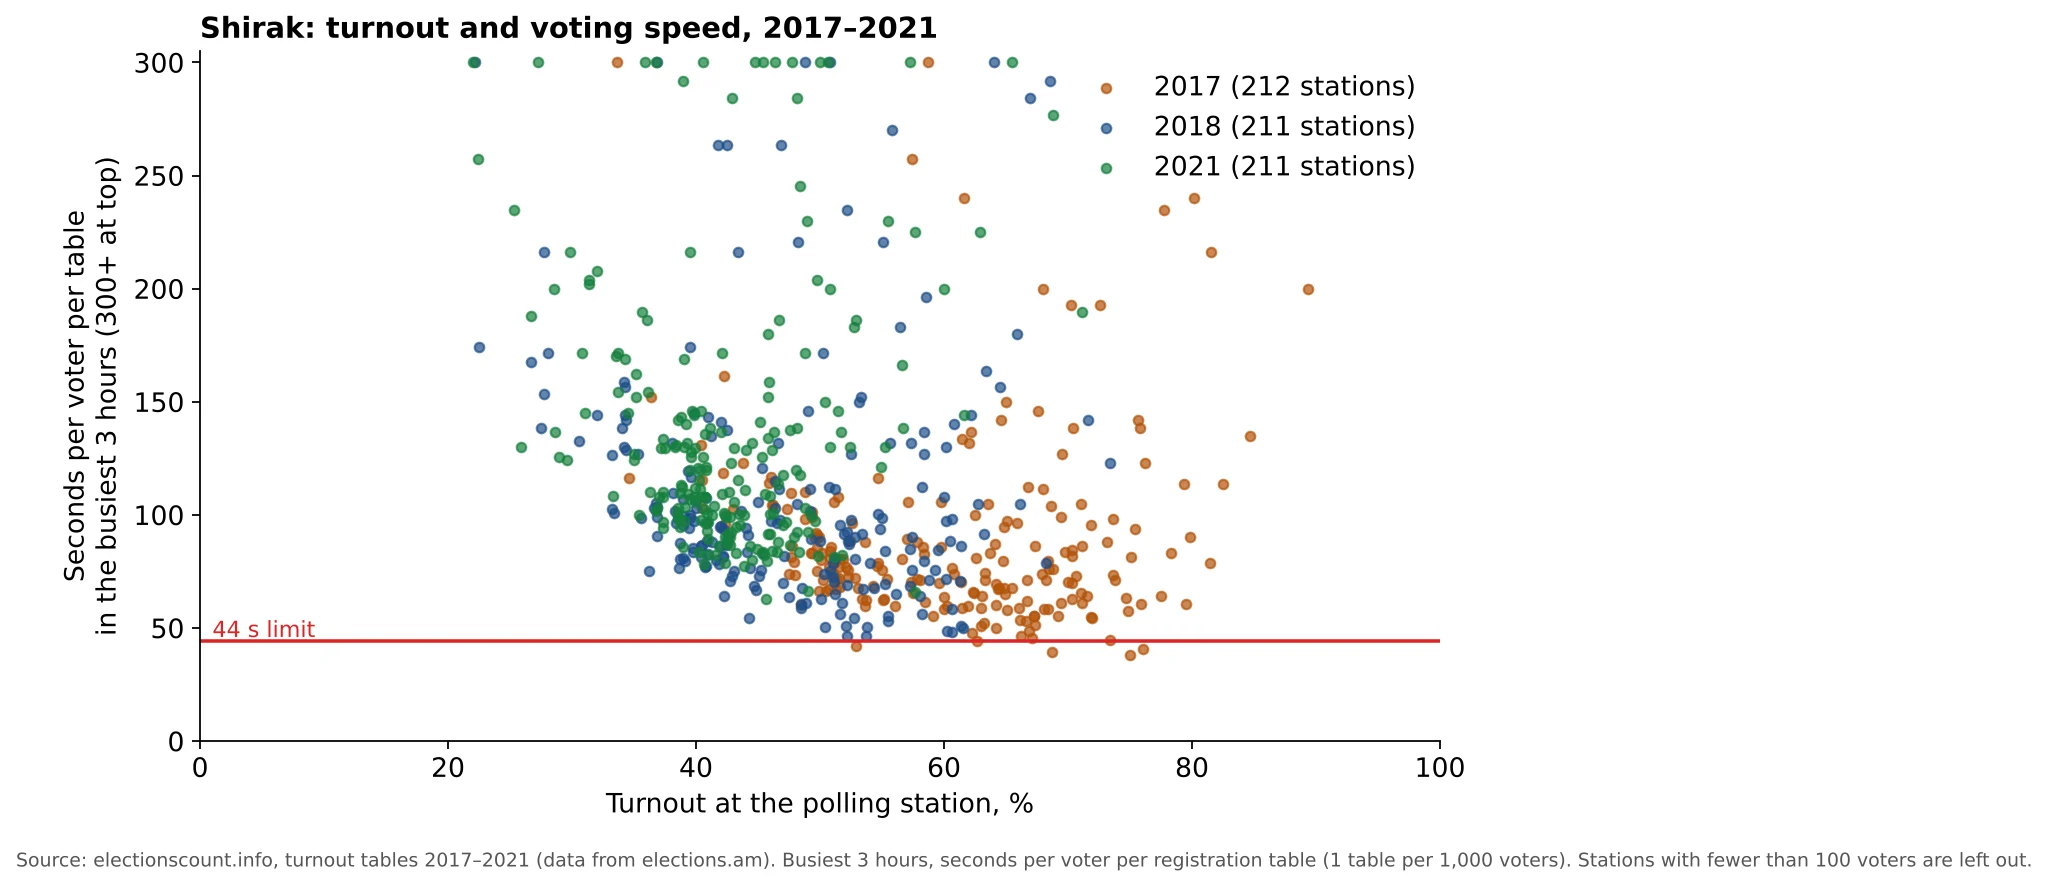 Shirak Province: Turnout and Voting Speed at Every Polling Station, 2017–2021Shirak Province: turnout 57.76% in 2017, 45.13% in 2018 and 41.24% in 2021; 4, 0 and 0 stations above physical capacity.With charts explained: 1 charts
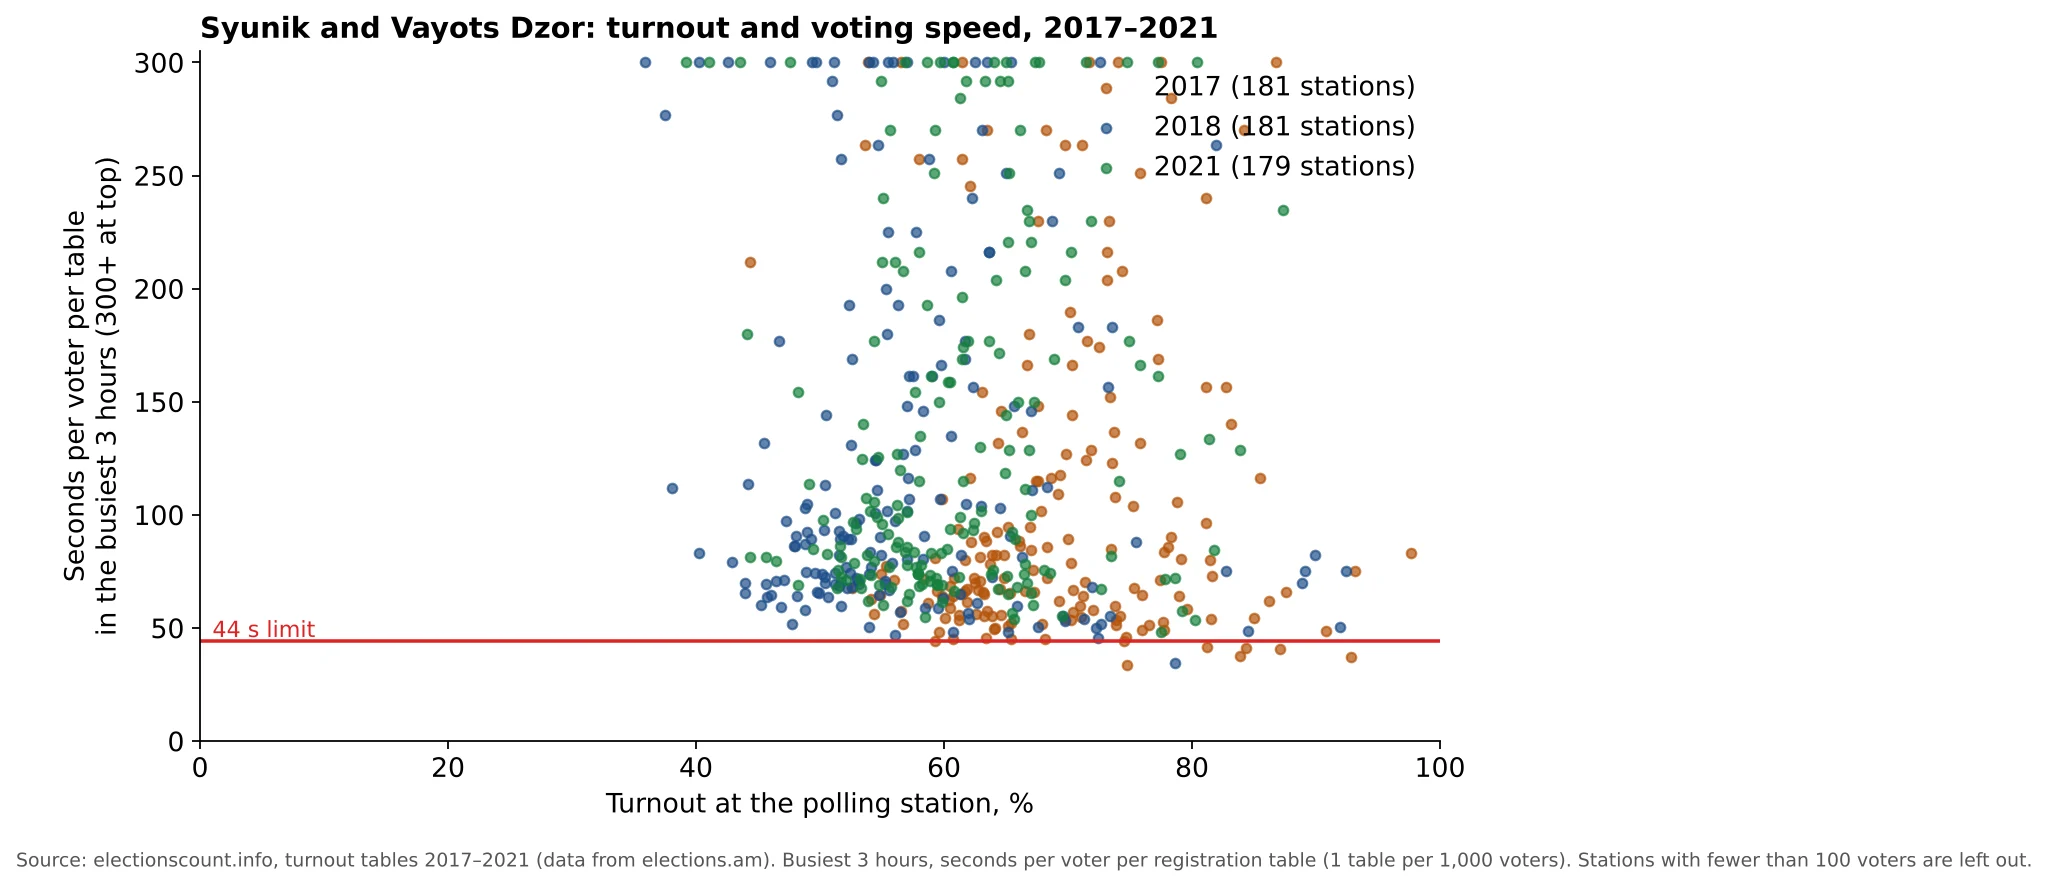 Syunik and Vayots Dzor Provinces: Turnout and Voting Speed at Every Polling Station, 2017–2021Syunik and Vayots Dzor Provinces: turnout 66.91% in 2017, 55.9% in 2018 and 59.09% in 2021; 6, 1 and 0 stations above physical capacity.With charts explained: 1 charts
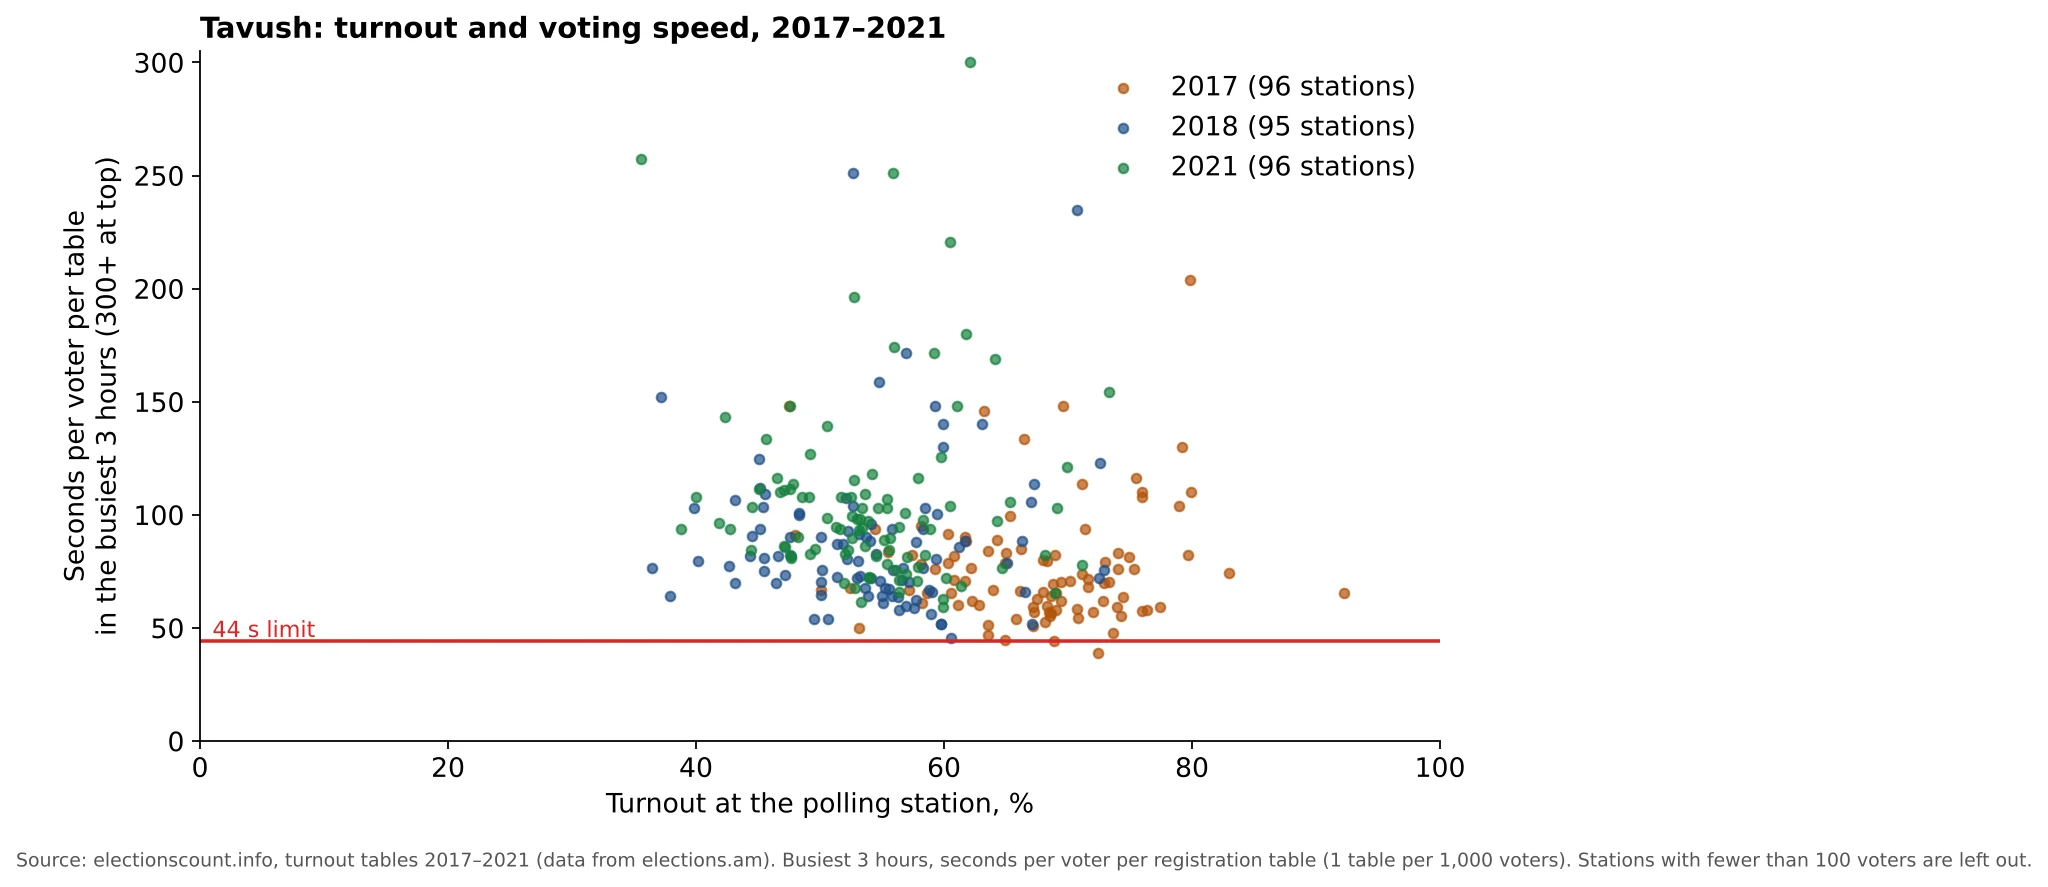 Tavush Province: Turnout and Voting Speed at Every Polling Station, 2017–2021Tavush Province: turnout 66.39% in 2017, 53.05% in 2018 and 53.48% in 2021; 1, 0 and 0 stations above physical capacity.With charts explained: 1 charts
2026 parliamentary elections
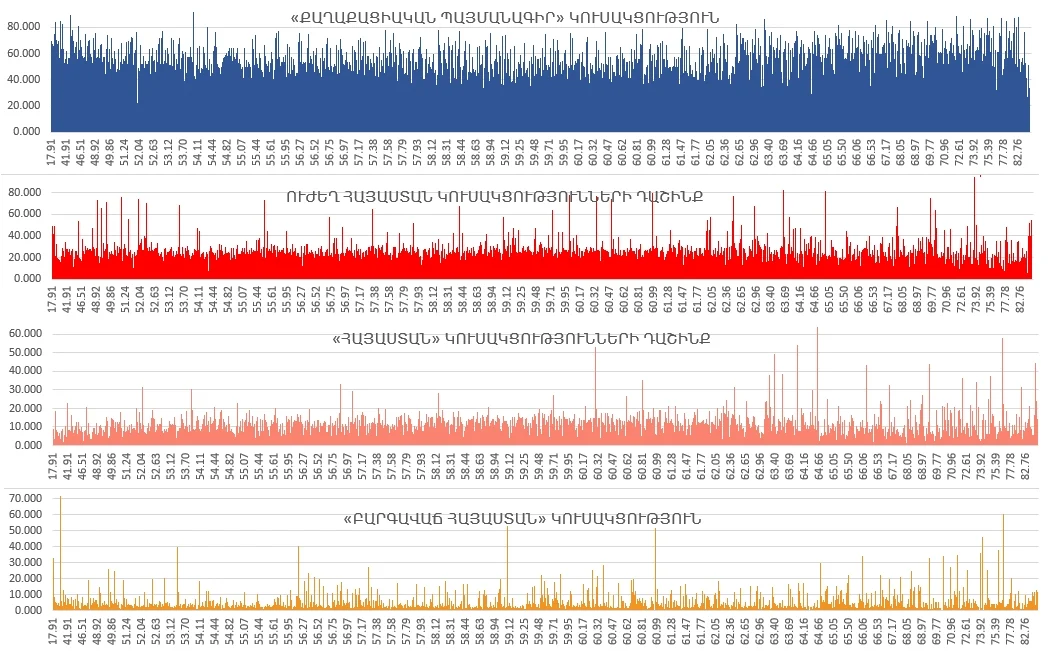 Armenia 2026: Party Votes at High- and Low-Turnout Polling Stations
2021 parliamentary elections
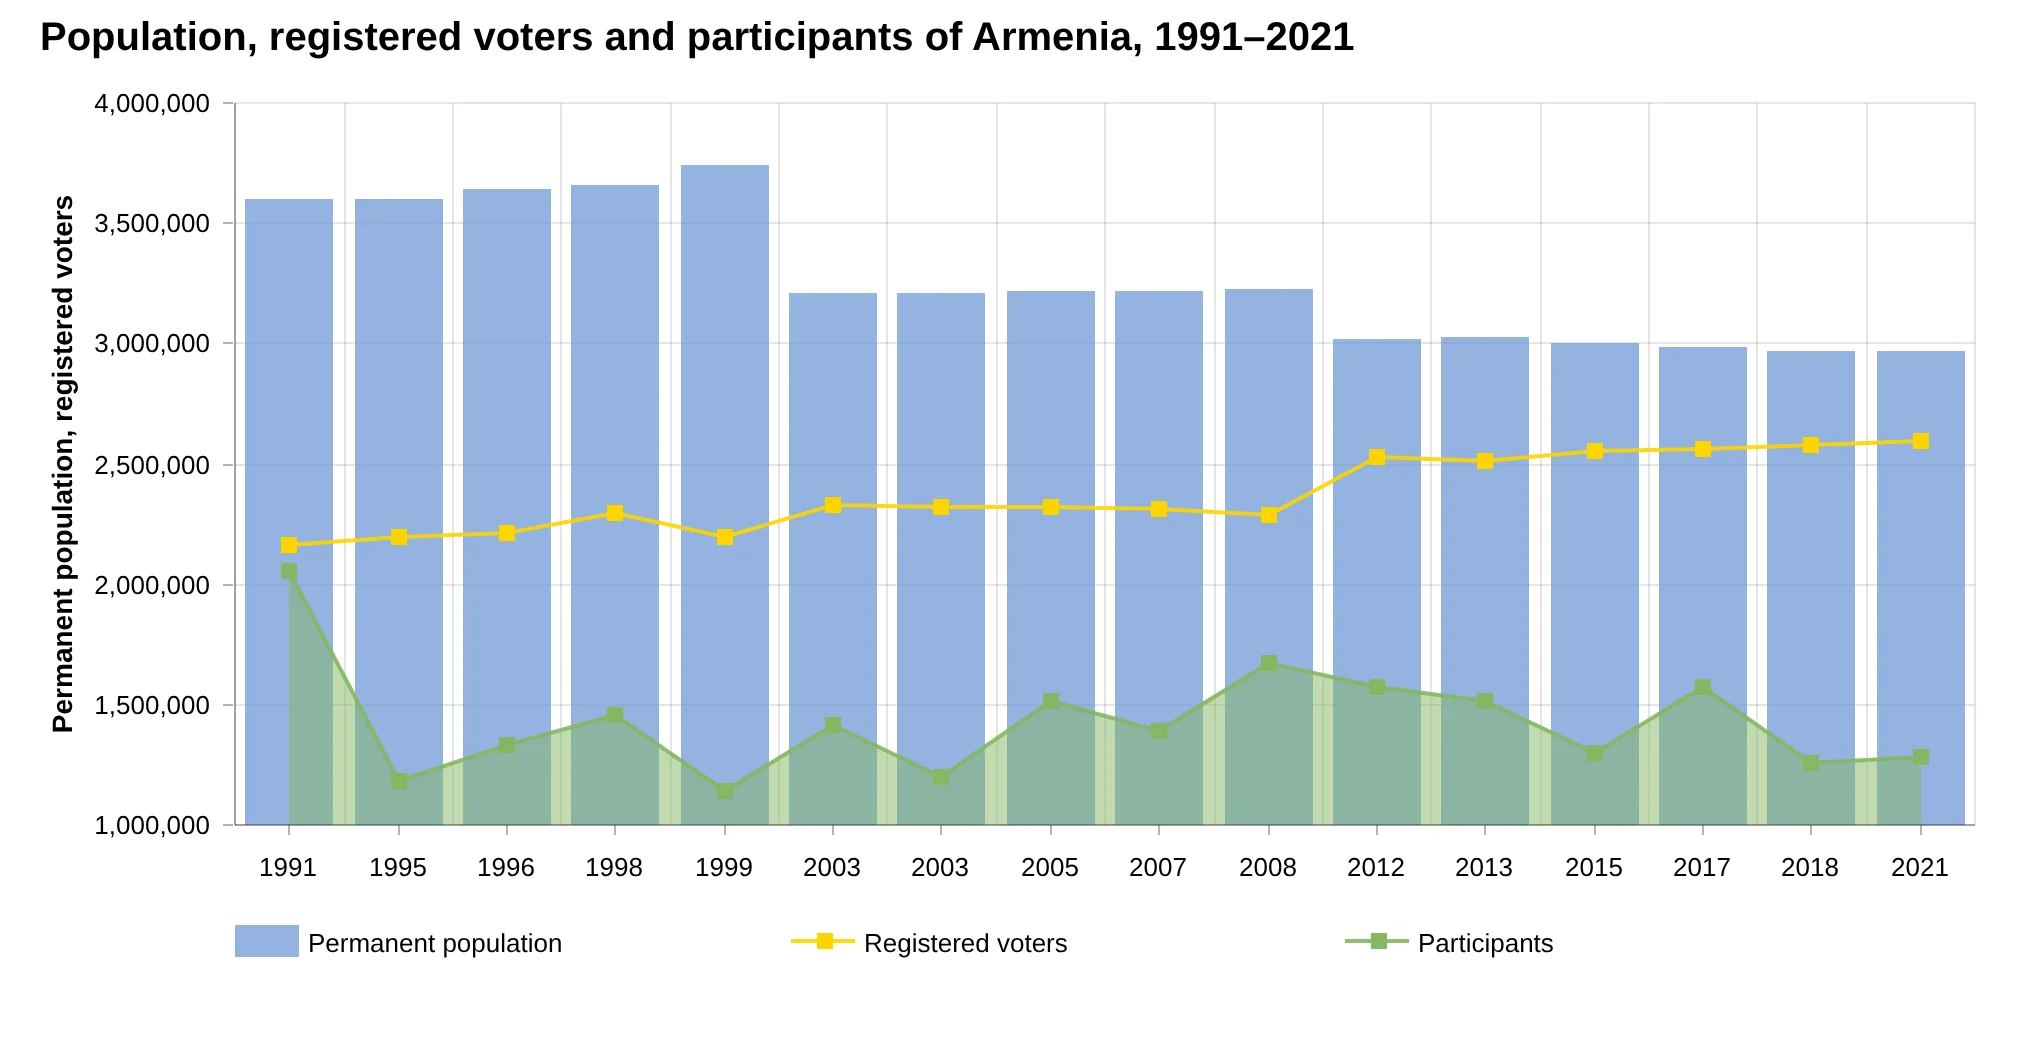 Armenia 1991–2021: Population, Registered Voters and Turnout in 16 VotesArmenia lost about 630,000 residents between 1991 and 2021, but gained 430,000 registered voters. Participation fell from 95% in 1991 to about half.With charts explained: 1 charts
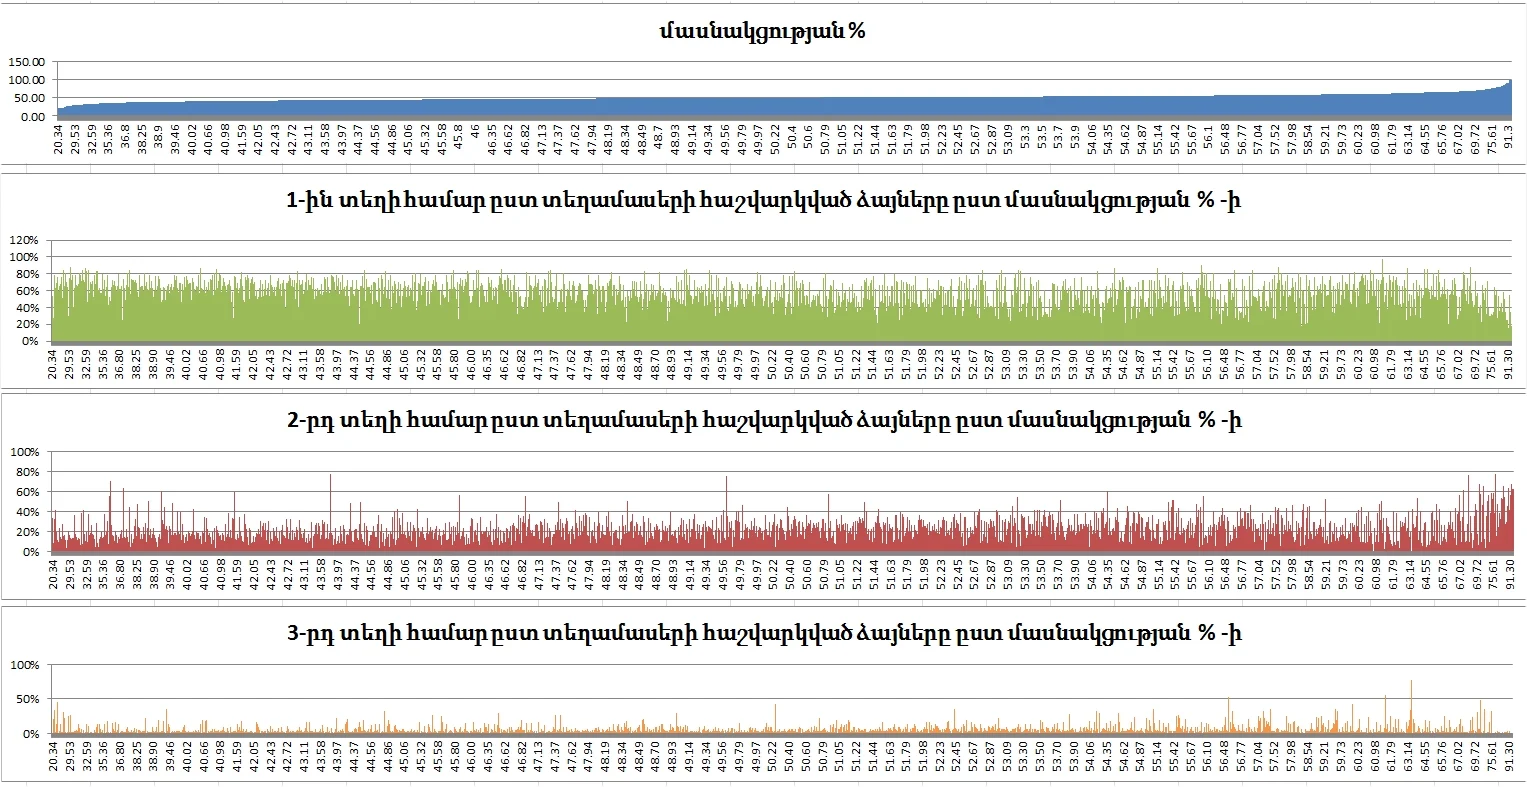 Armenia 2021: How the Top Three Parties' Votes Change with TurnoutCivil Contract's share stays about the same from the lowest to the highest turnout. The runner-up's share jumps only at the few stations with the very highest turnout.With charts explained: 1 charts
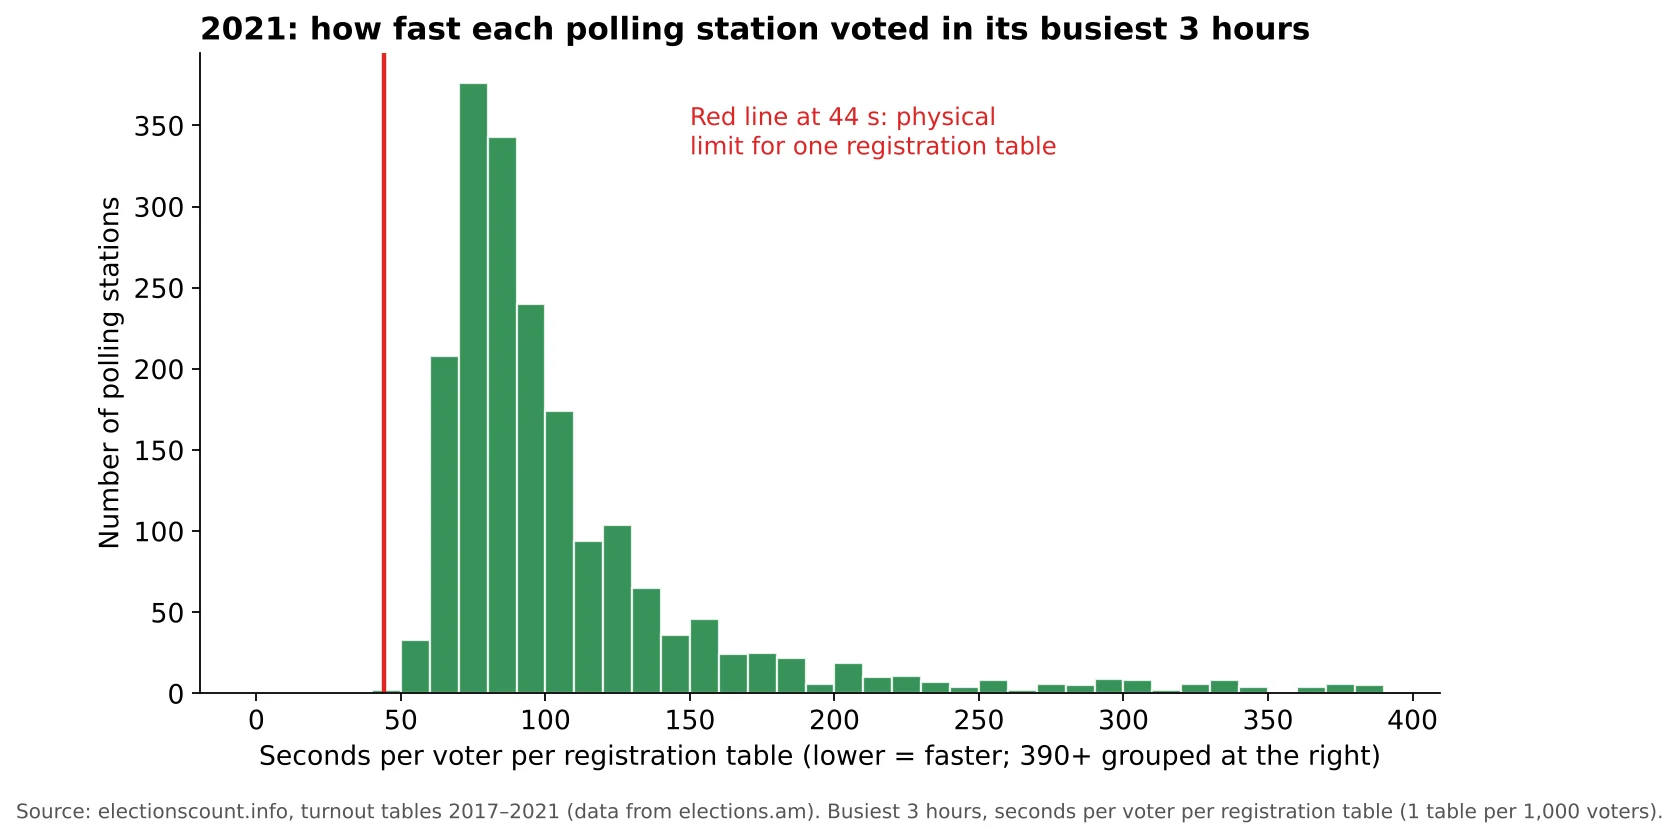 Armenia 2021: Turnout and Voting Speed at All 2,008 Polling StationsIn 2021 no polling station registered voters faster than the 44-second limit.With charts explained: 1 charts
2018 parliamentary elections
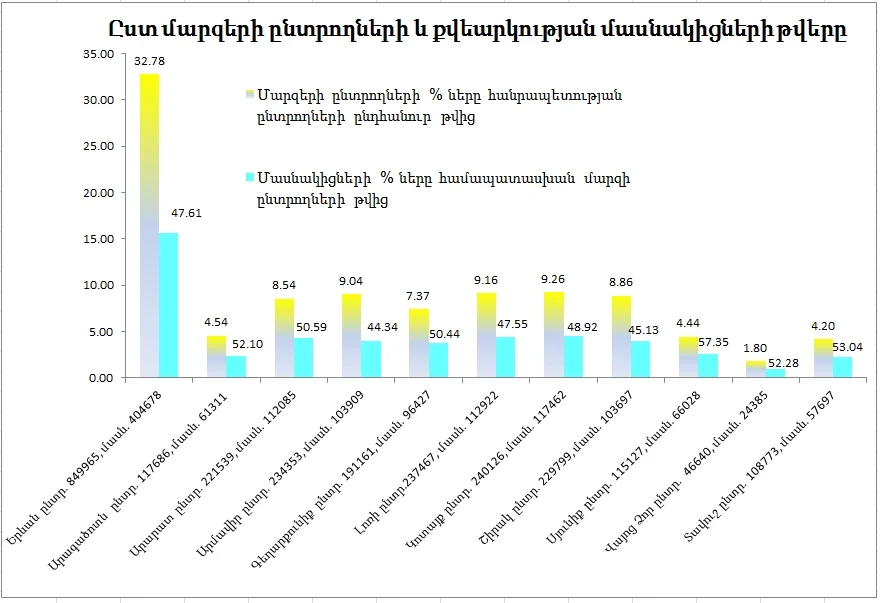 Armenia 2018: Population, Voters and Turnout by ProvinceArmenia's population fell after 2008, but the number of registered voters grew. In the 2018 snap election turnout was moderate everywhere, with no province far ahead.With charts explained: 3 charts
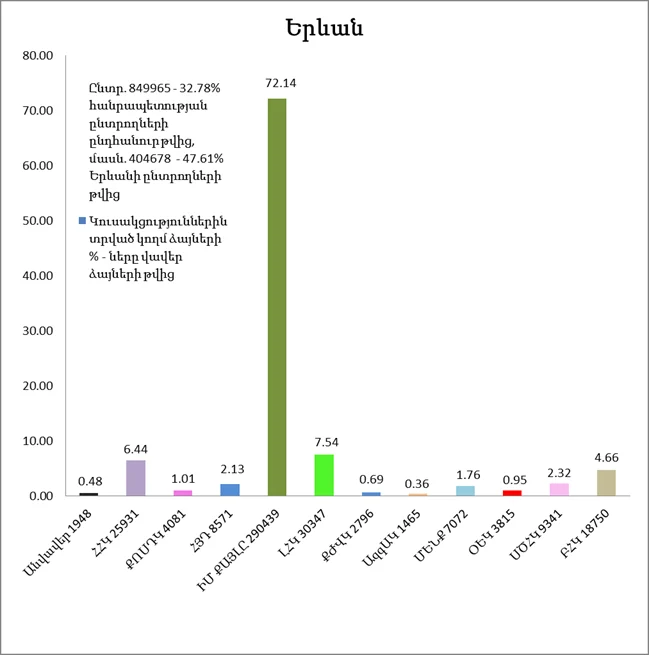 Armenia 2018: Results by Party in Yerevan, Towns and VillagesMy Step won about 70% everywhere: in Yerevan, in other towns and in villages. Unlike earlier elections, the winner did not depend on high-turnout rural areas.With charts explained: 5 charts
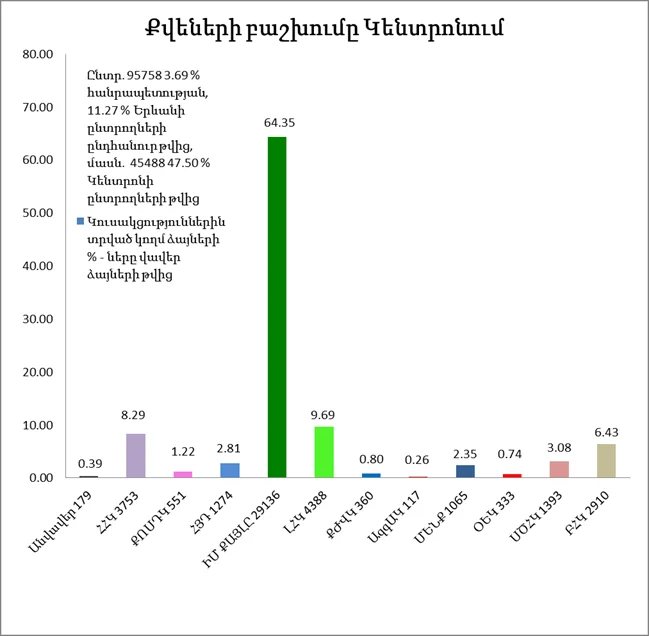 Armenia 2018: Results in All 12 Districts of YerevanTurnout in every Yerevan district was between 45% and 52%, and My Step won between 64% and 79%. The center voted most differently.With charts explained: 12 charts
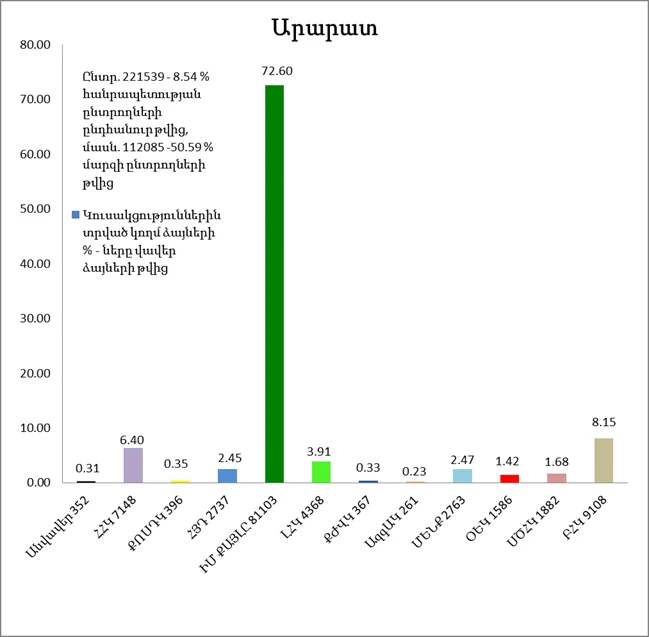 Armenia 2018: Results in All 10 ProvincesMy Step won 66–75% in every province. Turnout ranged only from 44% to 57%, and the provinces with record turnout in 2015 were ordinary in 2018.With charts explained: 10 charts
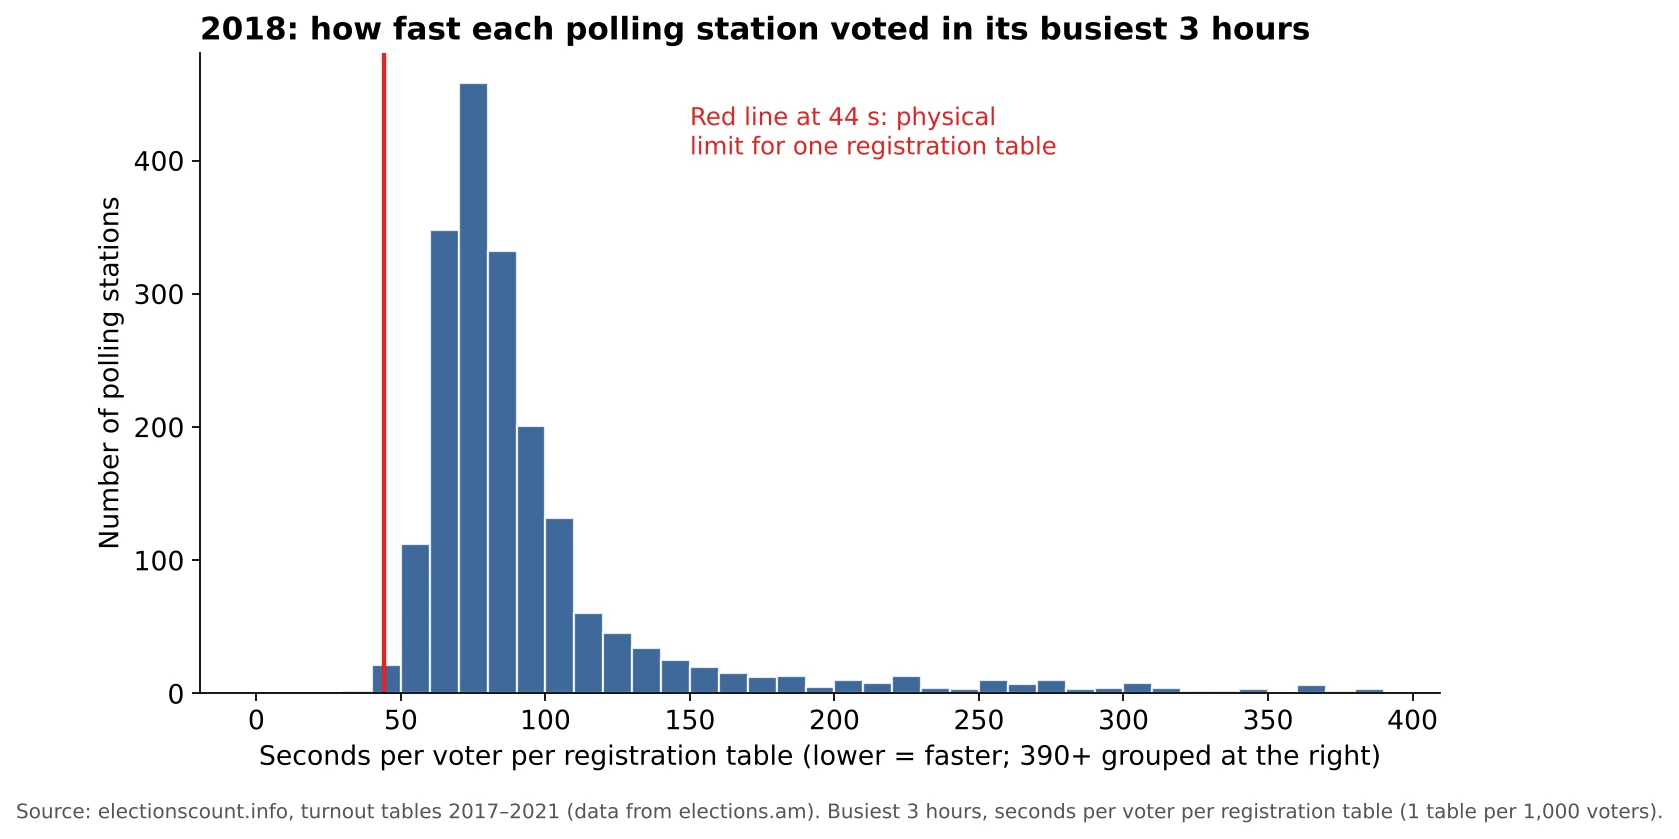 Armenia 2018: Turnout and Voting Speed at All 2,010 Polling StationsIn the snap election of December 2018 turnout fell to 48.63% and the speeds relaxed.With charts explained: 1 charts
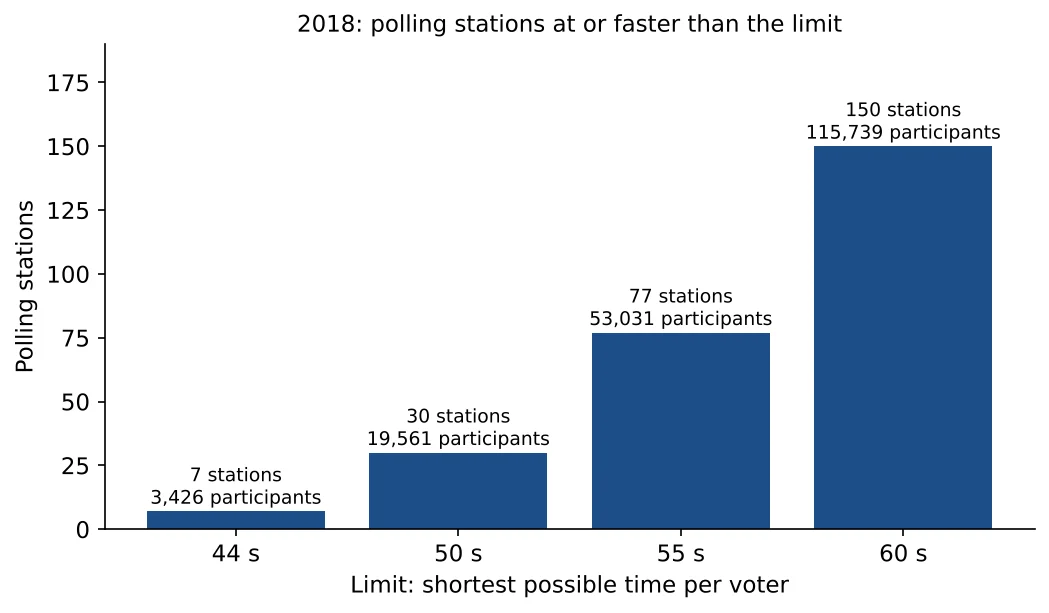 Armenia 2018: 150 Polling Stations at or Faster Than 60 Seconds per VoterIn 2018 only 150 stations reached 60 seconds per voter, against 668 in 2017; at the 44-second limit, 7 remain.With charts explained: 2 charts
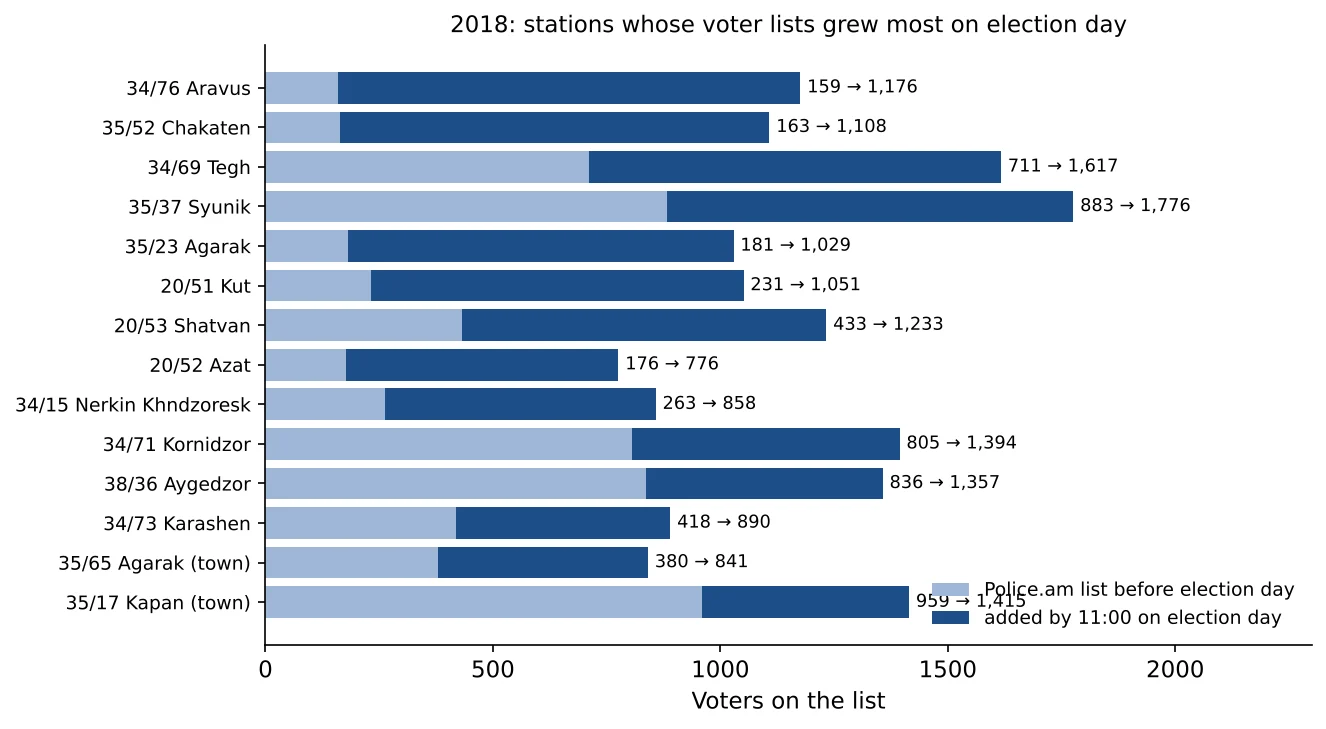 Armenia 2018: Voter Lists and Turnout on Election Day, Preliminary and FinalOn the morning of 9 December 2018, 18,700 voters were added to the lists of 77 polling stations; the list of Aravus grew from 159 to 1,176.With charts explained: 1 charts
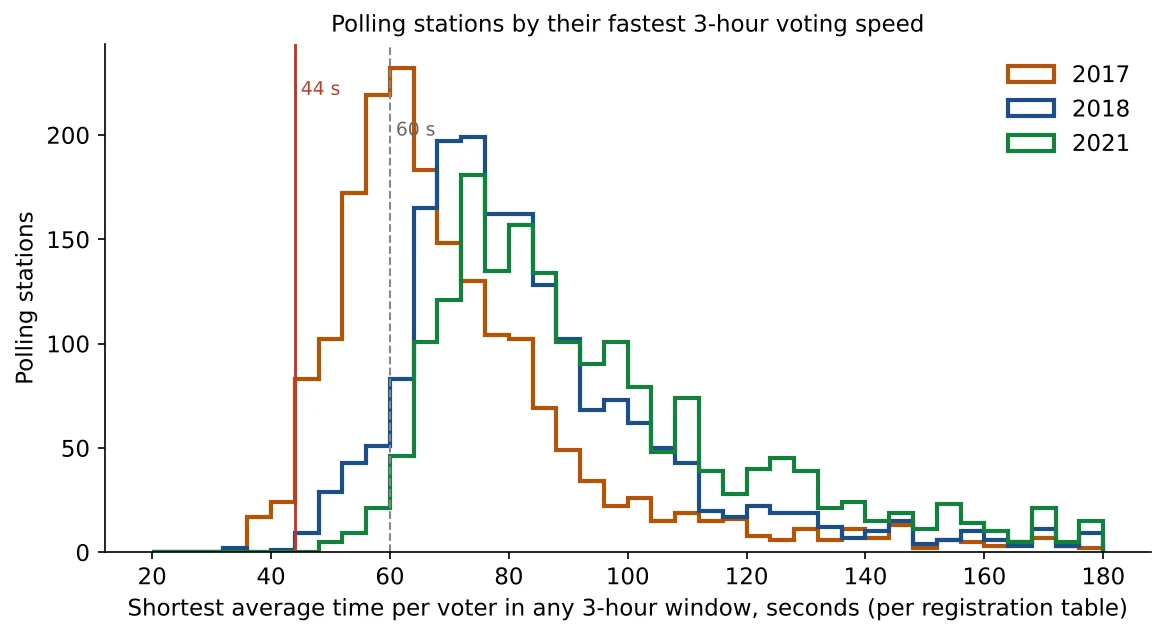 Armenia 2018: How Fast Polling Stations Voted, Compared with 2017 and 2021In 2017 the typical polling station reached 67.5 seconds per voter at its busiest; in 2018, 81.2; in 2021, 91.5.With charts explained: 2 charts
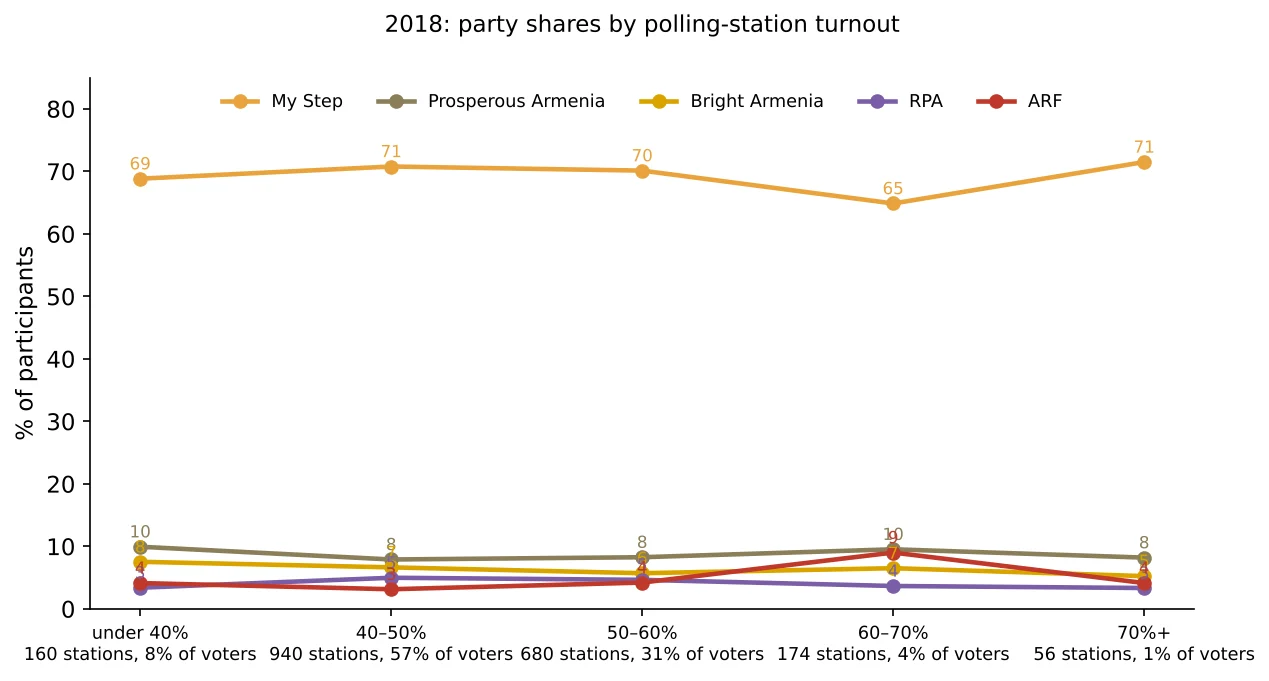 Armenia 2018: Party Votes by Polling-Station TurnoutIn 2018 My Step’s share was the same, about 70%, at low- and high-turnout stations alike: no list gained as turnout rose.With charts explained: 2 charts
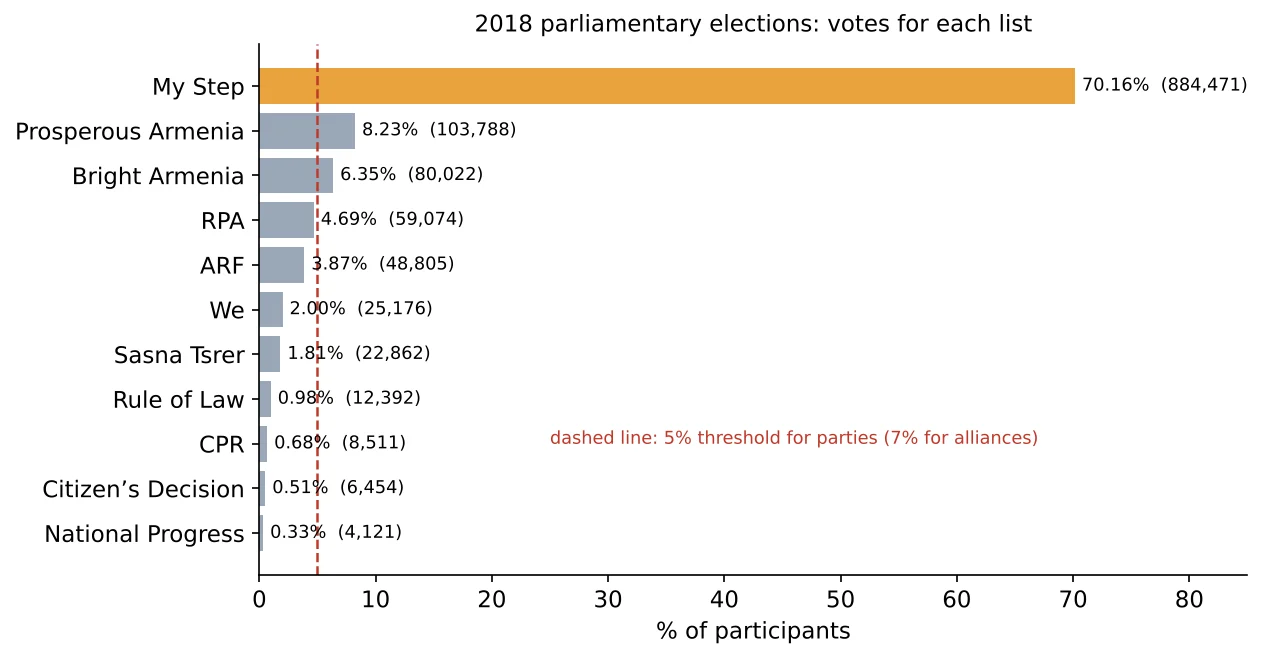 Armenia 2018: Election Results by Polling Station, in VotesThe full 2018 result, station by station: My Step 884,471 votes, Prosperous Armenia 103,788, Bright Armenia 80,022; the former ruling RPA 59,074.With charts explained: 1 charts
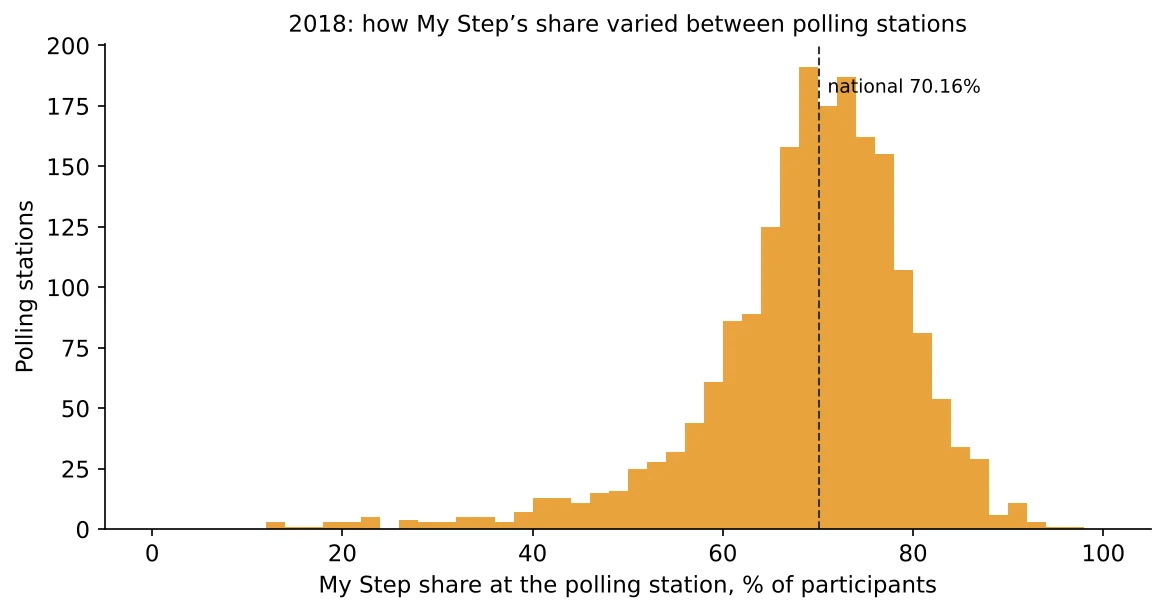 Armenia 2018: Results by Polling Station in Percent, and the Stations That Voted DifferentlyAt most polling stations My Step got between 60% and 80%; a handful of villages voted almost unanimously for another list.With charts explained: 1 charts
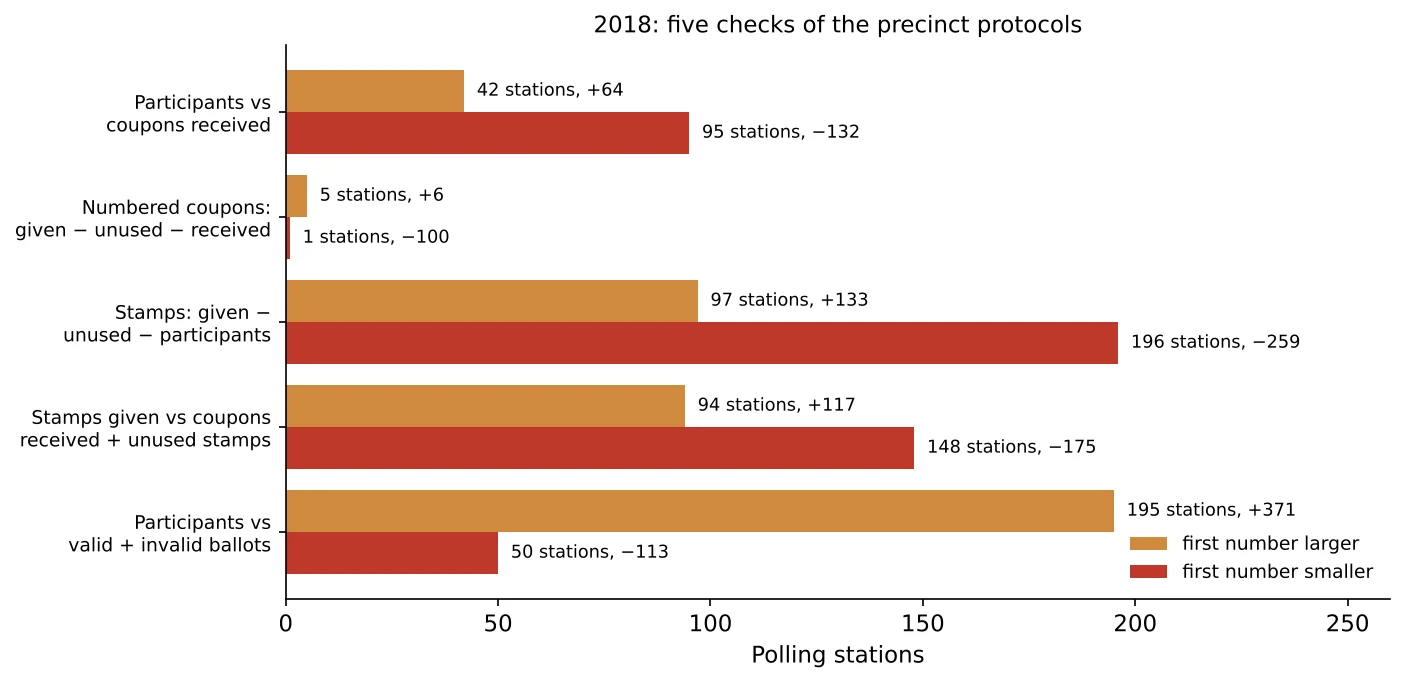 Armenia 2018: Mismatches in the Protocols, Coupons and StampsIn 2018 the protocol numbers disagree at 405 polling stations, by 796 in total: about a quarter of the mismatches found in 2013 and 2015.With charts explained: 1 charts
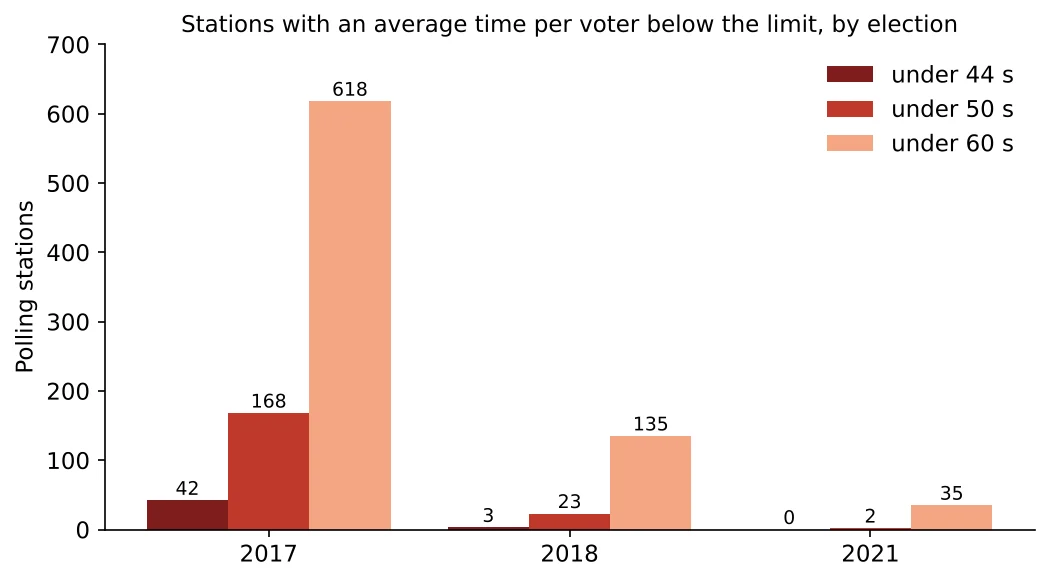 Armenia 2012–2018: Polling Stations With Impossibly Fast Voting, Election by ElectionPolling stations reporting voters faster than 44 seconds per registration table: 42 in 2017, 3 in 2018, none in 2021.With charts explained: 2 charts
2017 parliamentary elections
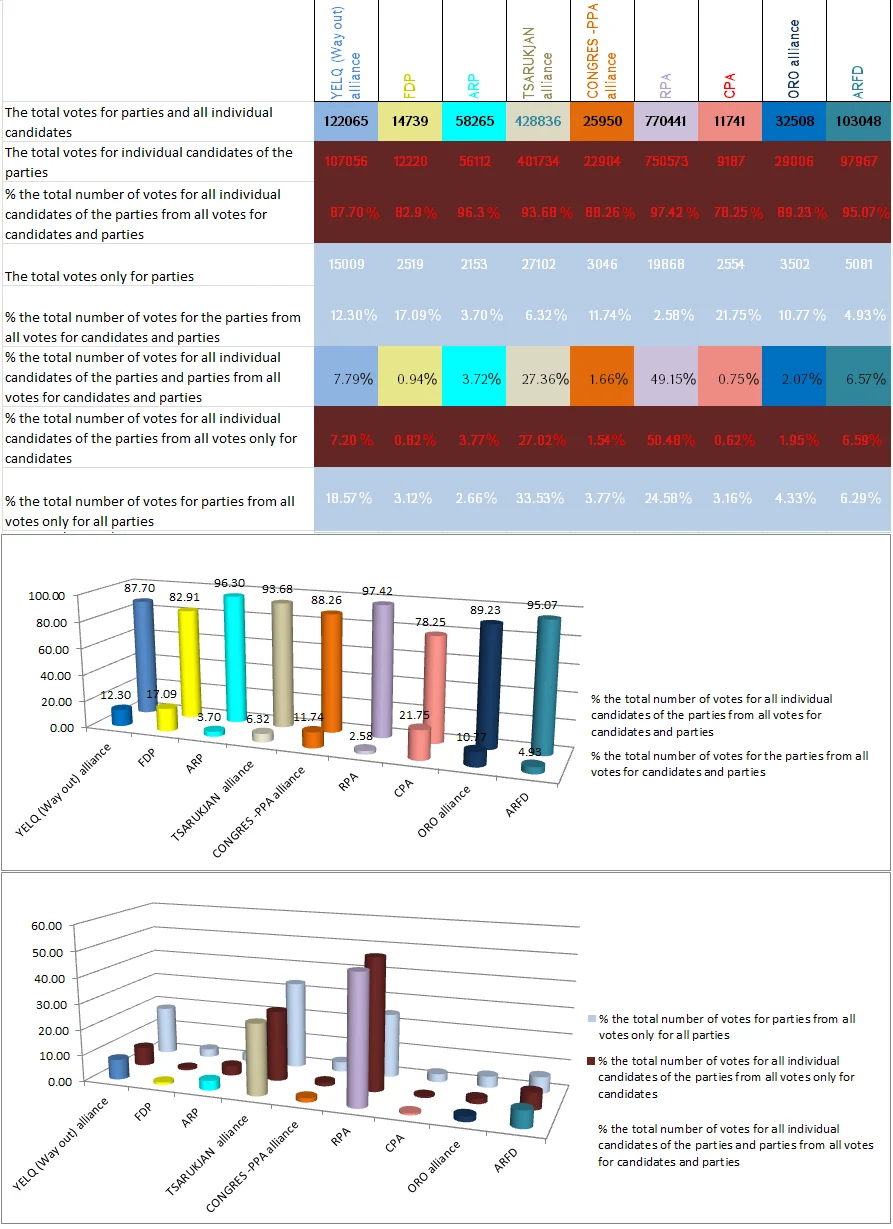 Armenia 2017: Votes for Parties and for District Candidates ComparedAlmost all votes for the ruling party came with a vote for a local candidate. Among voters who chose a party only, its share was half as large.With charts explained: 1 charts
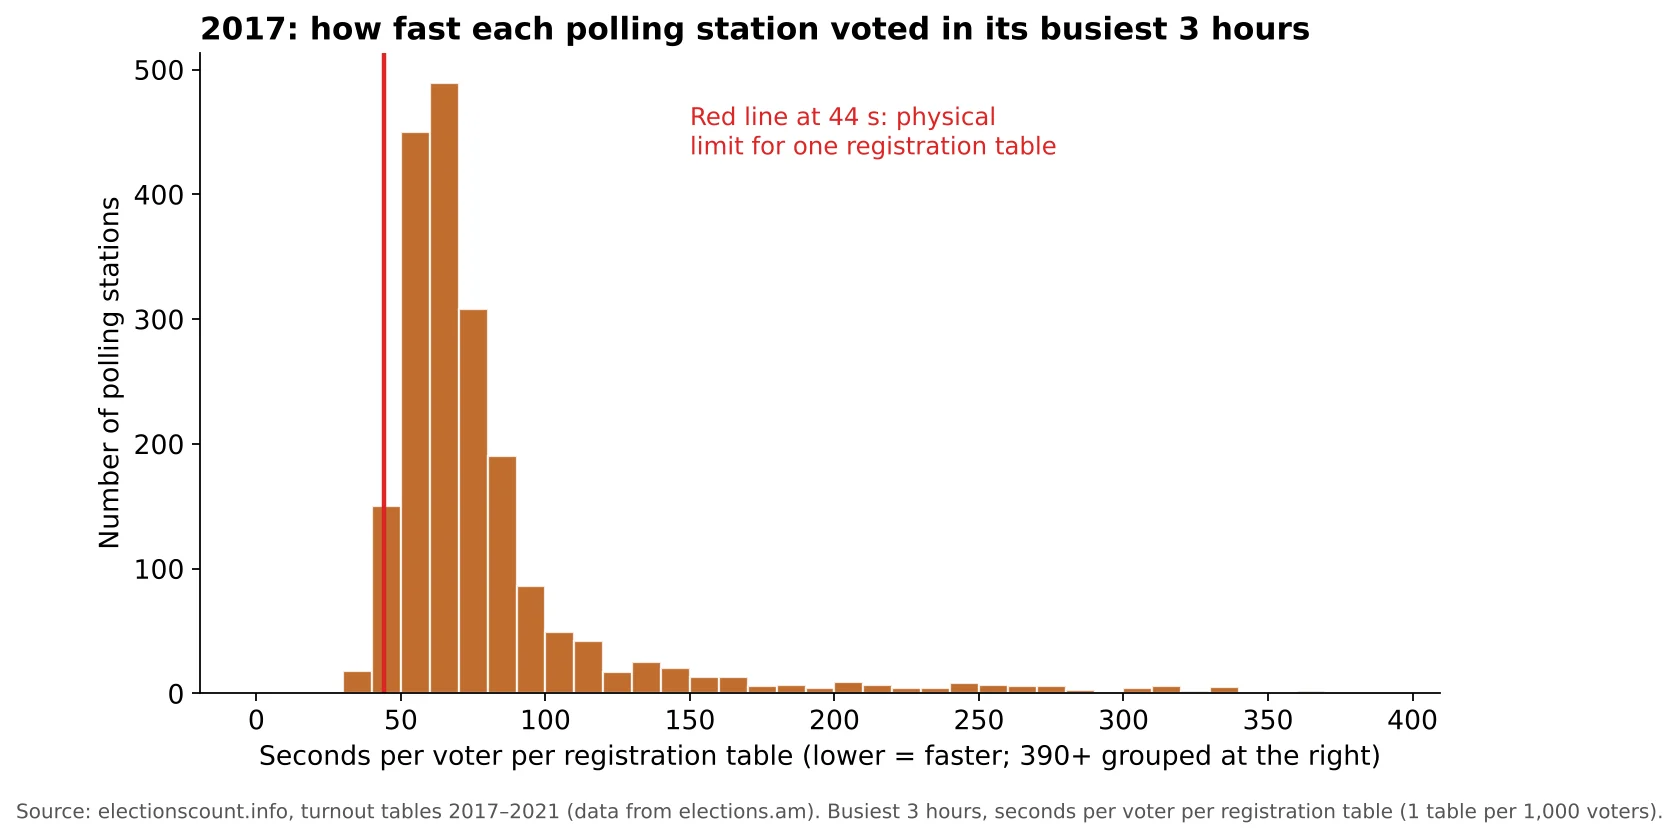 Armenia 2017: Turnout and Voting Speed at All 2,009 Polling StationsThe 2017 election had the highest turnout of the three, 60.86%, and the most stations close to capacity.With charts explained: 1 charts
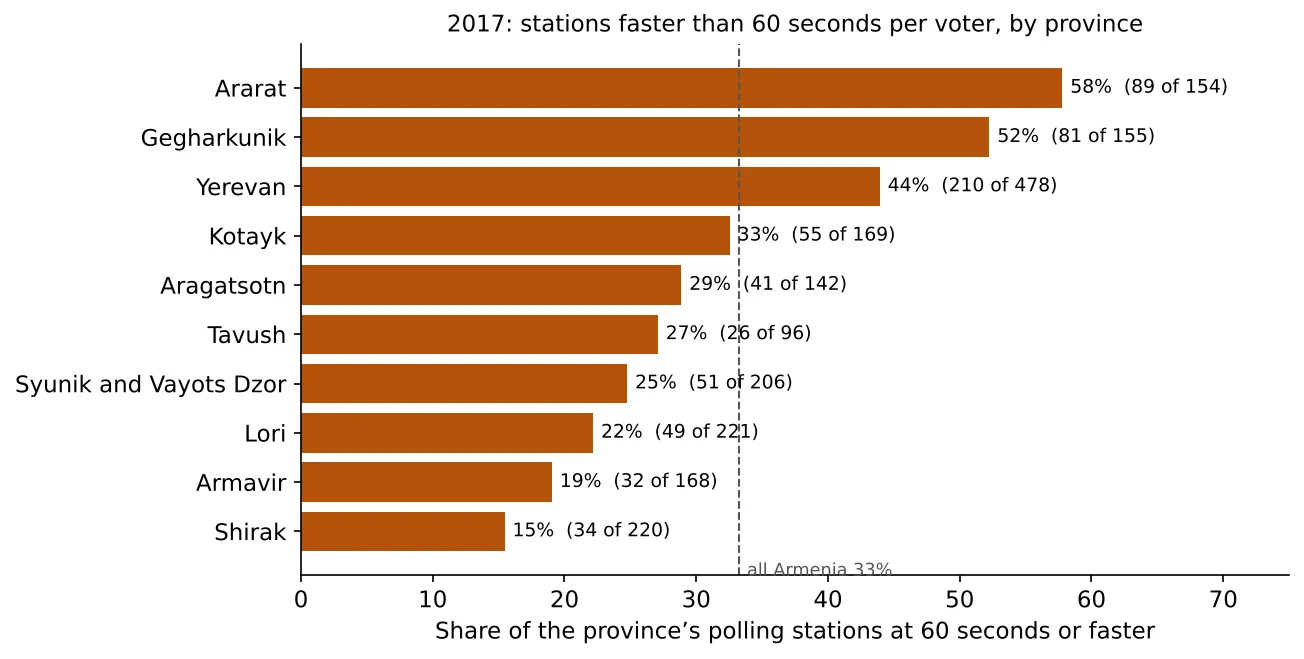 Armenia 2017: 668 Polling Stations Faster Than 60 Seconds per VoterWith a cautious limit of 60 seconds per voter, a third of Armenia’s polling stations, with 41% of the voters, reported more voters than they could register in at least one 3-hour window.With charts explained: 2 charts
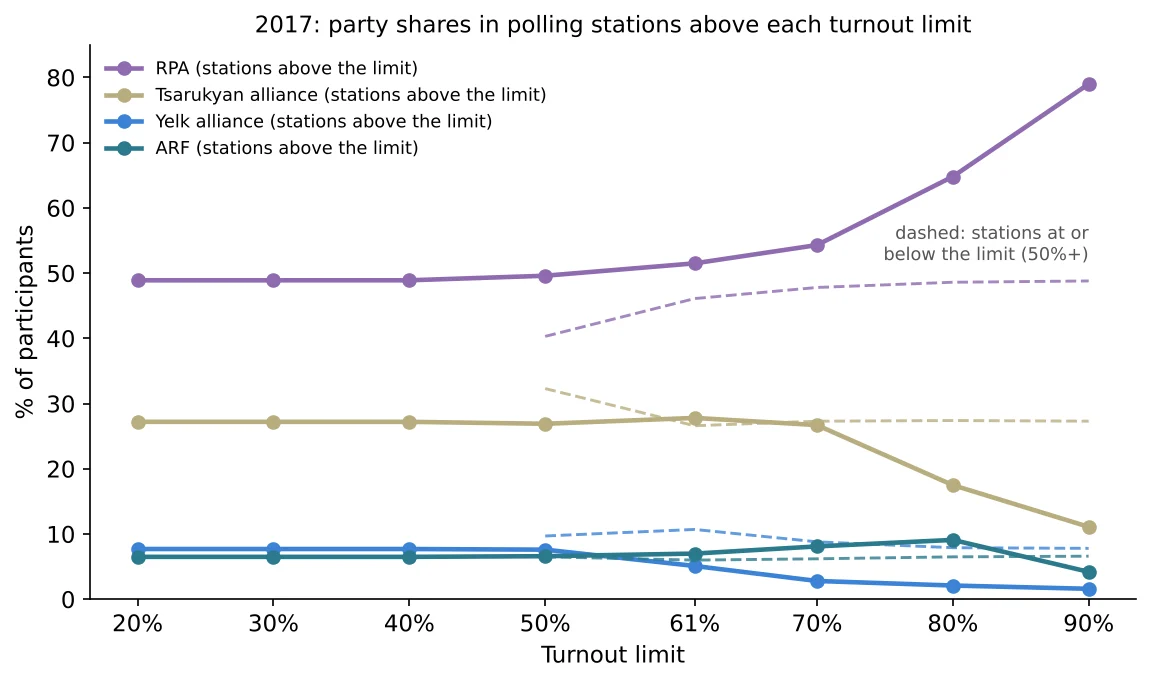 Armenia 2017 Parliamentary Elections: Party Votes Above and Below Each Turnout LimitIn polling stations with turnout at or below 61%, the ruling RPA had 46.1% of the vote; above 90% turnout it had 79%. The opposition Yelk alliance fell below its threshold in the high-turnout half.With charts explained: 9 charts
2015 constitutional referendum
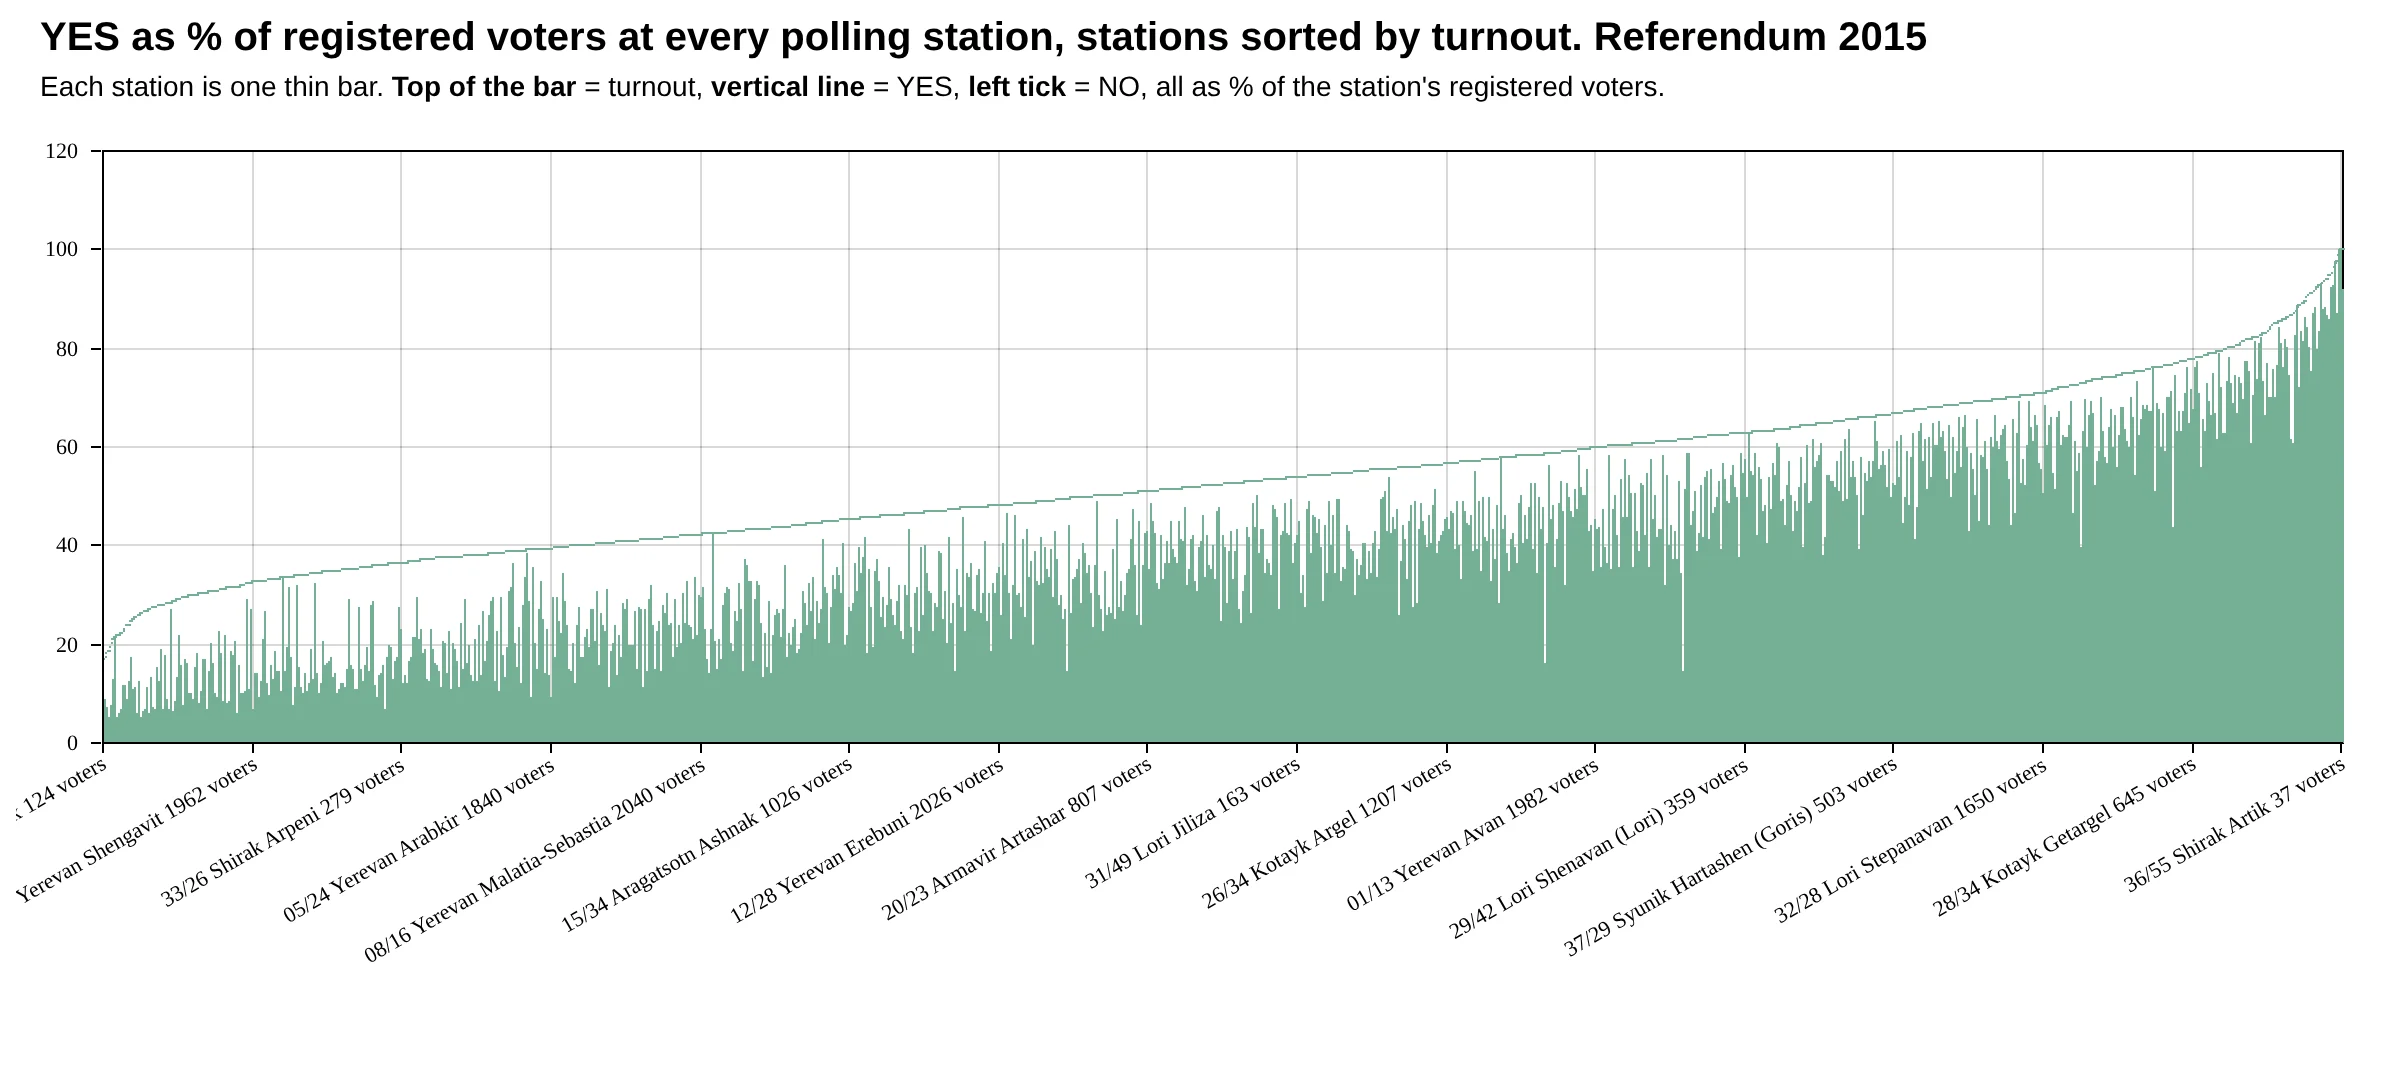 Armenia’s 2015 Constitutional Referendum: What the Polling Station Numbers ShowWhere turnout was high, YES was high too, and many of those stations reported numbers that do not add up.With charts explained: 3 charts
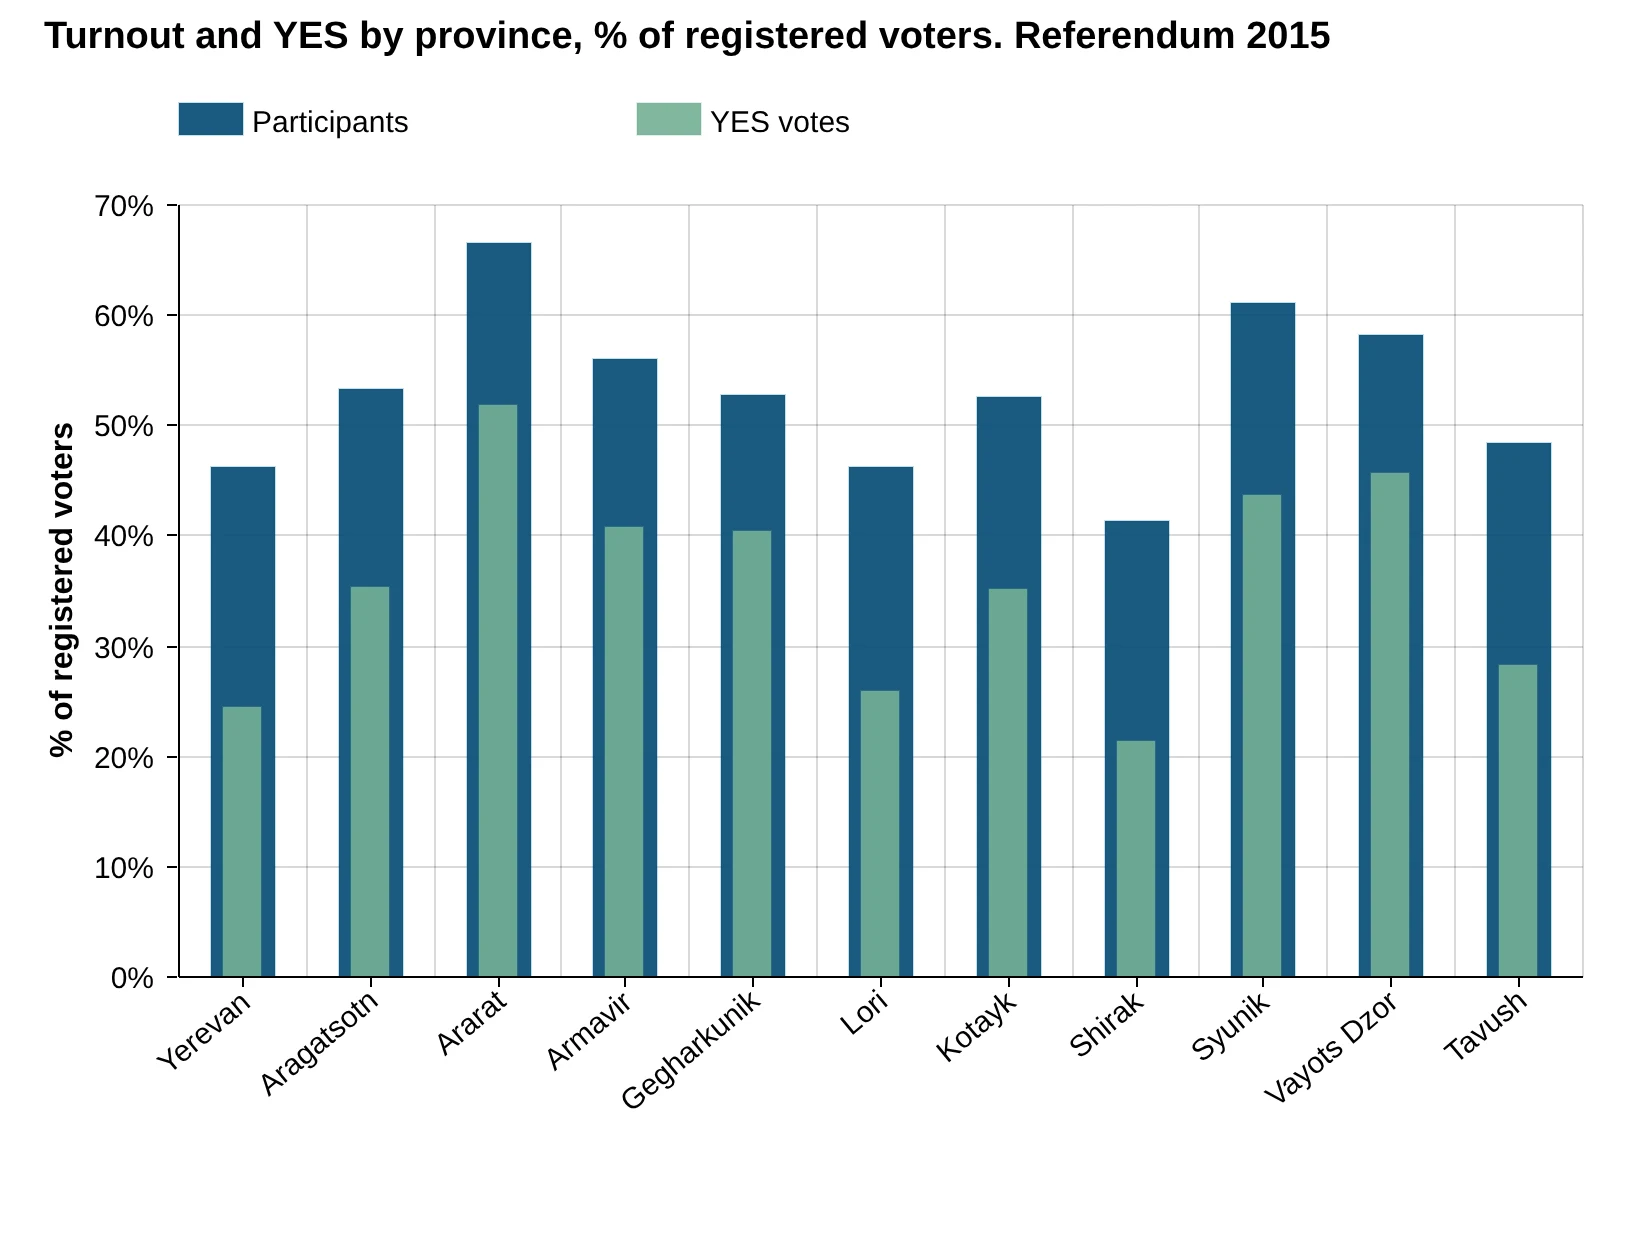 2015 Referendum in Armenia by Province: Turnout and YES VotesIn the provinces where more people were reported to vote, a larger share of them voted YES, and those provinces carried the referendum over its legal threshold.With charts explained: 2 charts
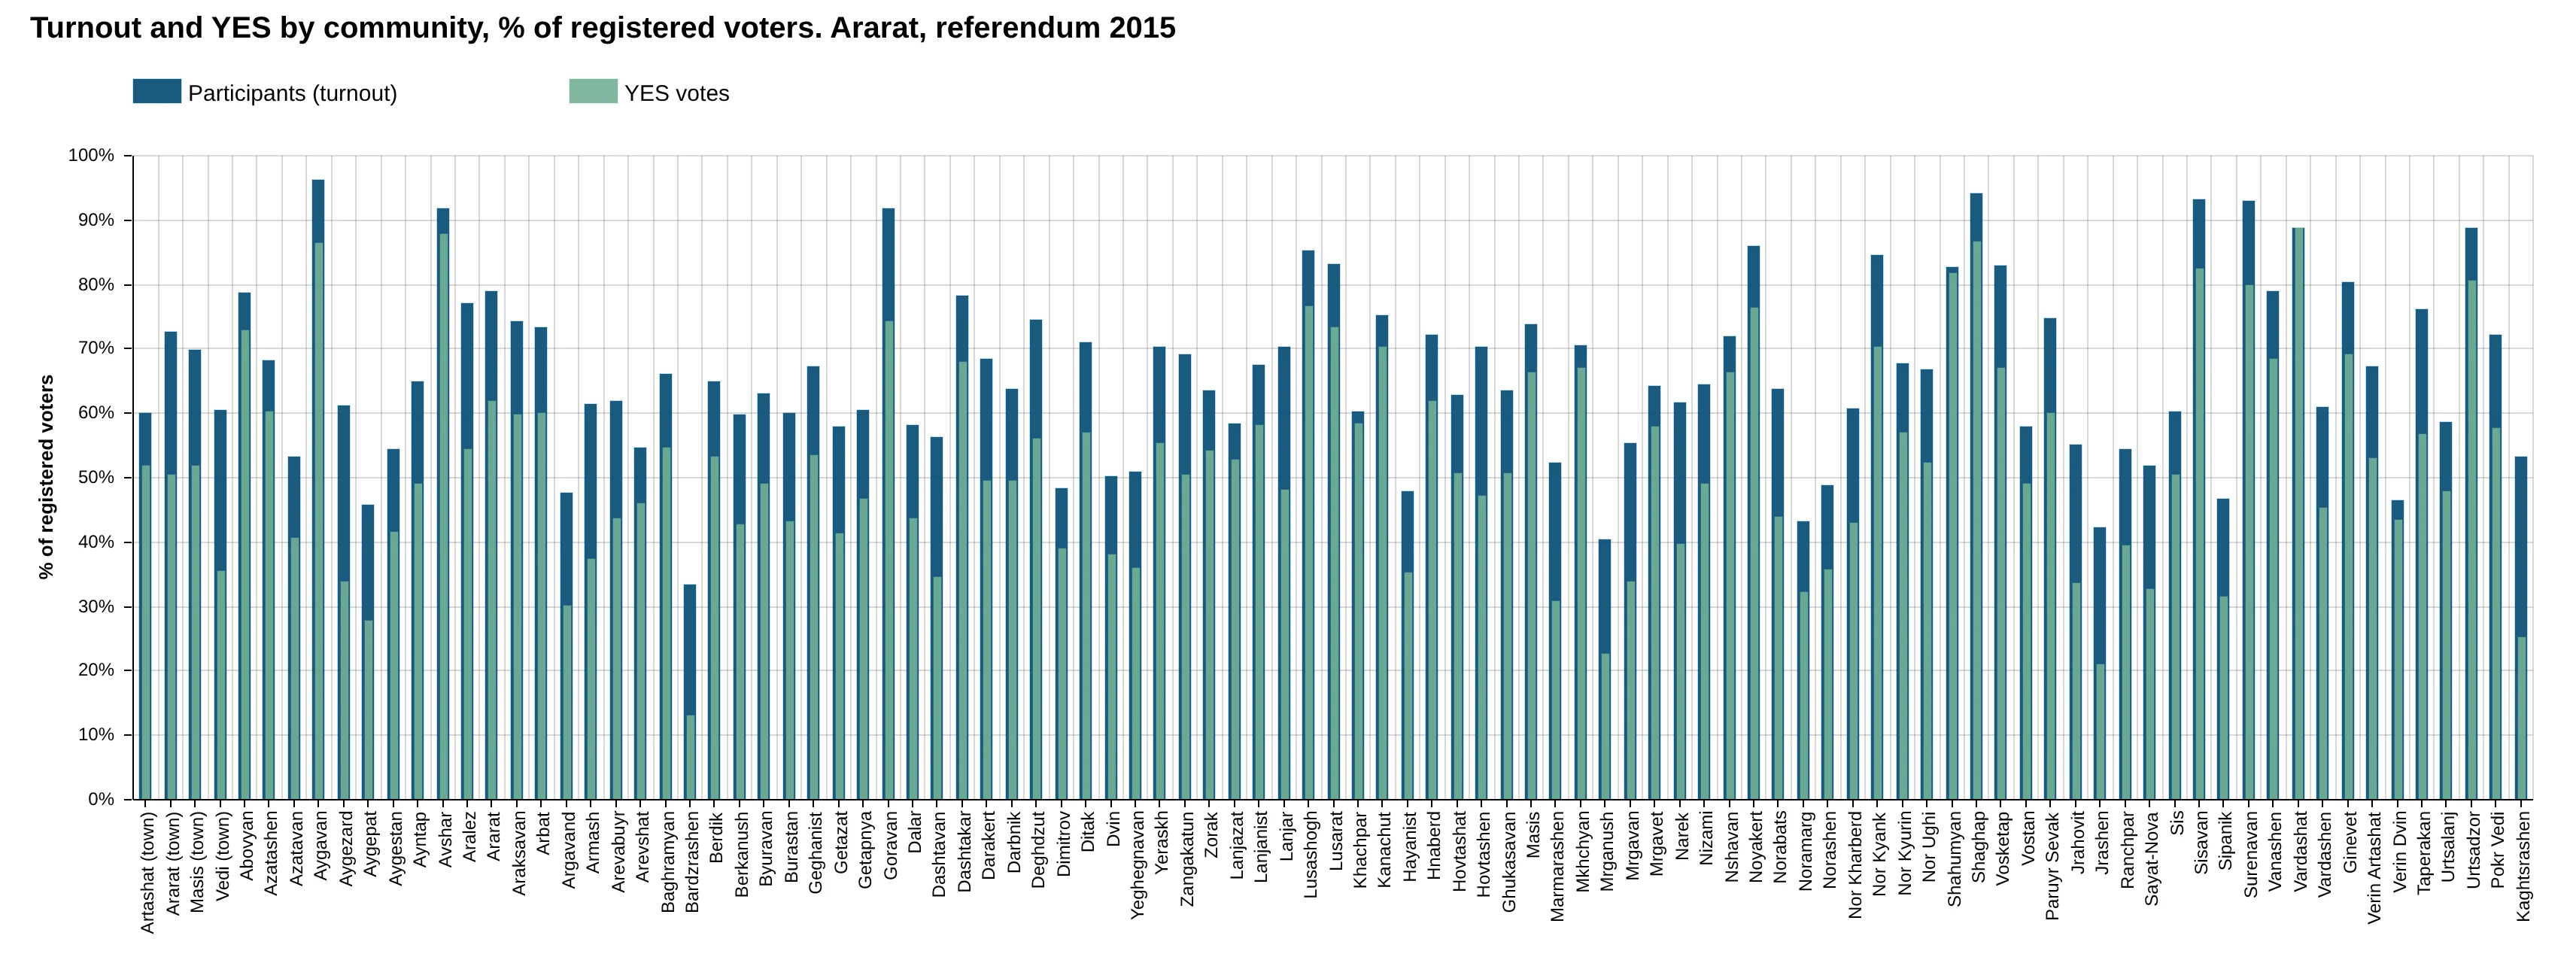 2015 Referendum in Armenia by Community: Turnout and YES in 924 Towns and VillagesProvince by province, the towns had moderate turnout and split votes, while many villages reported 80–100% turnout and almost unanimous YES.With charts explained: 11 charts
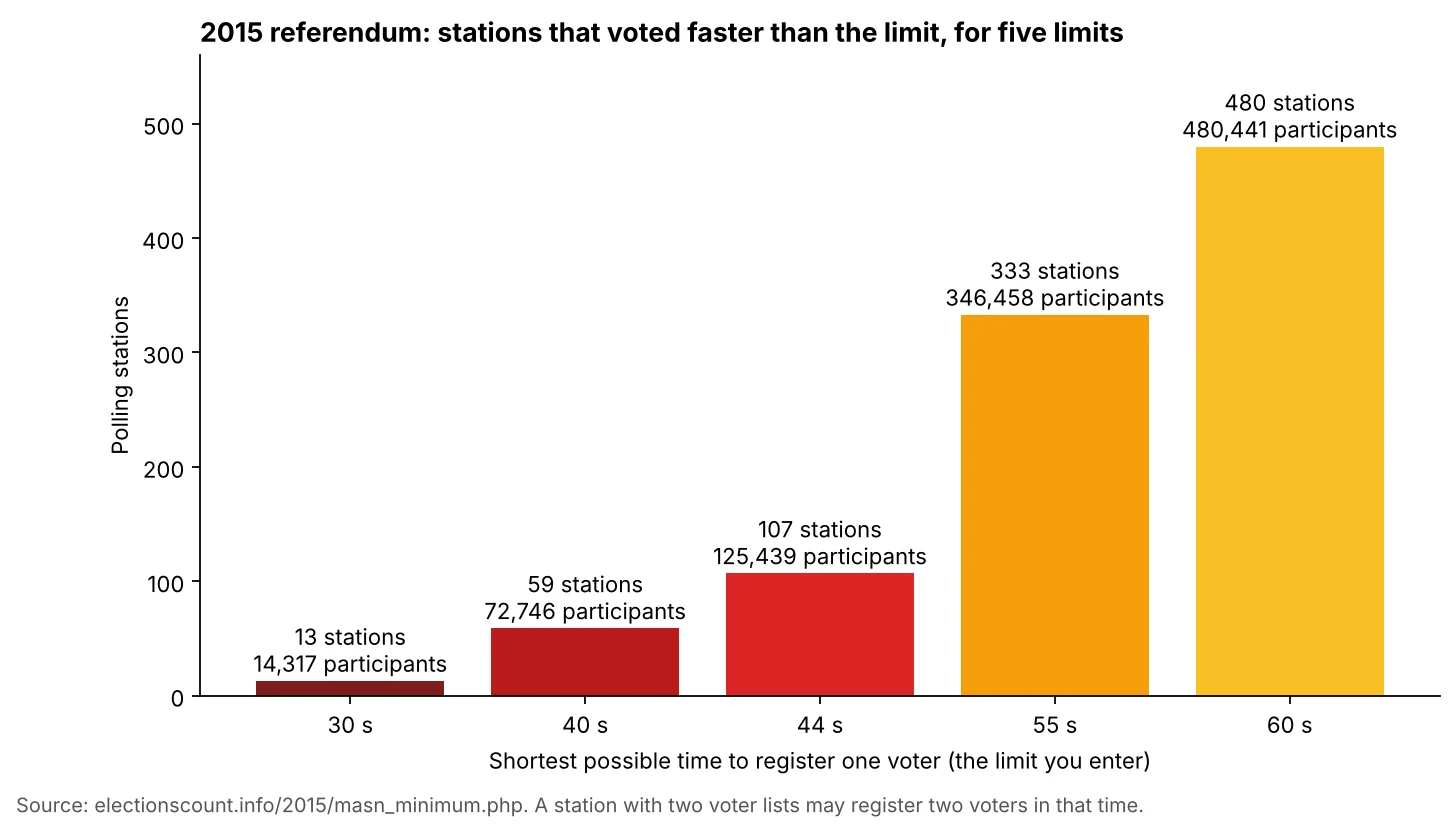 Armenia 2015 Referendum: 107 Polling Stations That Voted Faster Than Physically PossibleWith a limit of 44 seconds per voter, 107 polling stations registered voters faster than possible. Their turnout was 70.69% and YES took about 77%.With charts explained: 2 charts
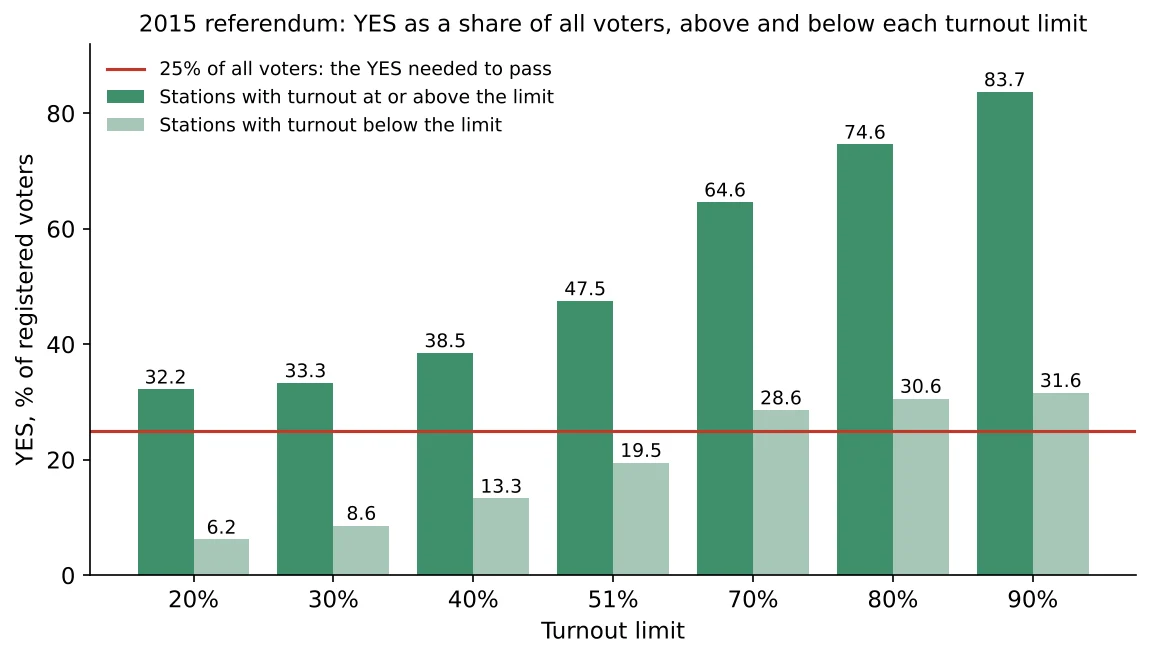 Armenia 2015 Referendum: YES and NO Above and Below Each Turnout LimitAt polling stations with turnout under 51%, which had 55% of all voters, YES was only 19.5% of registered voters, below the 25% that the draft needed.With charts explained: 8 charts
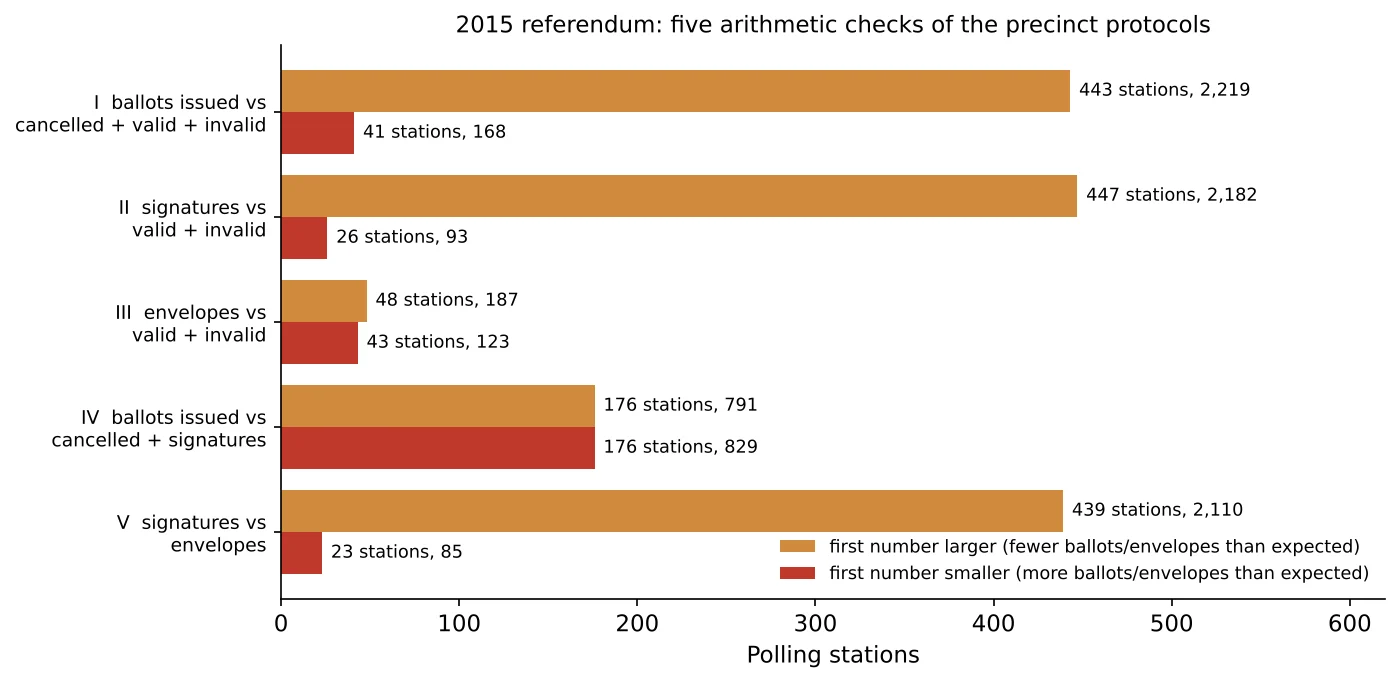 Armenia 2015 Referendum: 614 Polling Stations Whose Protocol Numbers Do Not Add UpChecking ballots, signatures and envelopes against each other finds mismatches at 614 polling stations, totalling at least 3,265, six times the official “inaccuracy” of 555.With charts explained: 2 charts
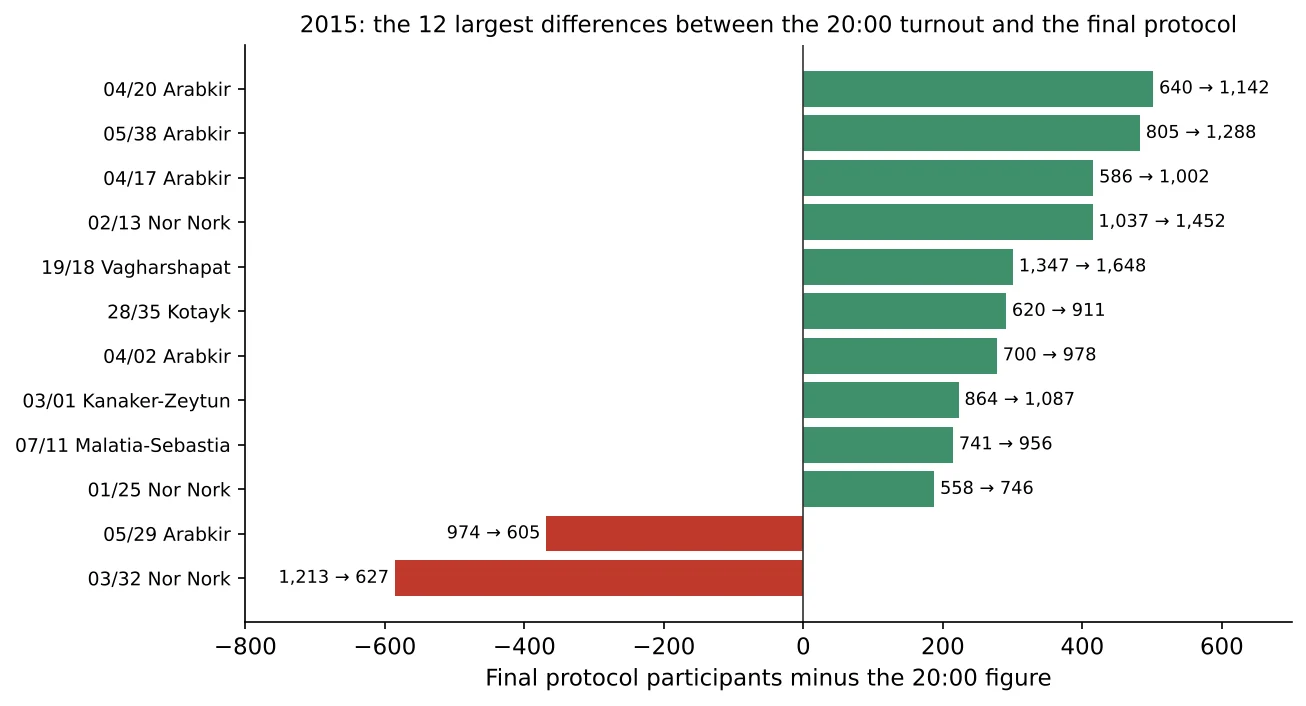 Armenia 2015 Referendum: Final Protocols vs the Turnout Published at 20:00The final protocols show exactly 6,000 more participants than the CEC published at 20:00, when voting had already ended.With charts explained: 1 charts
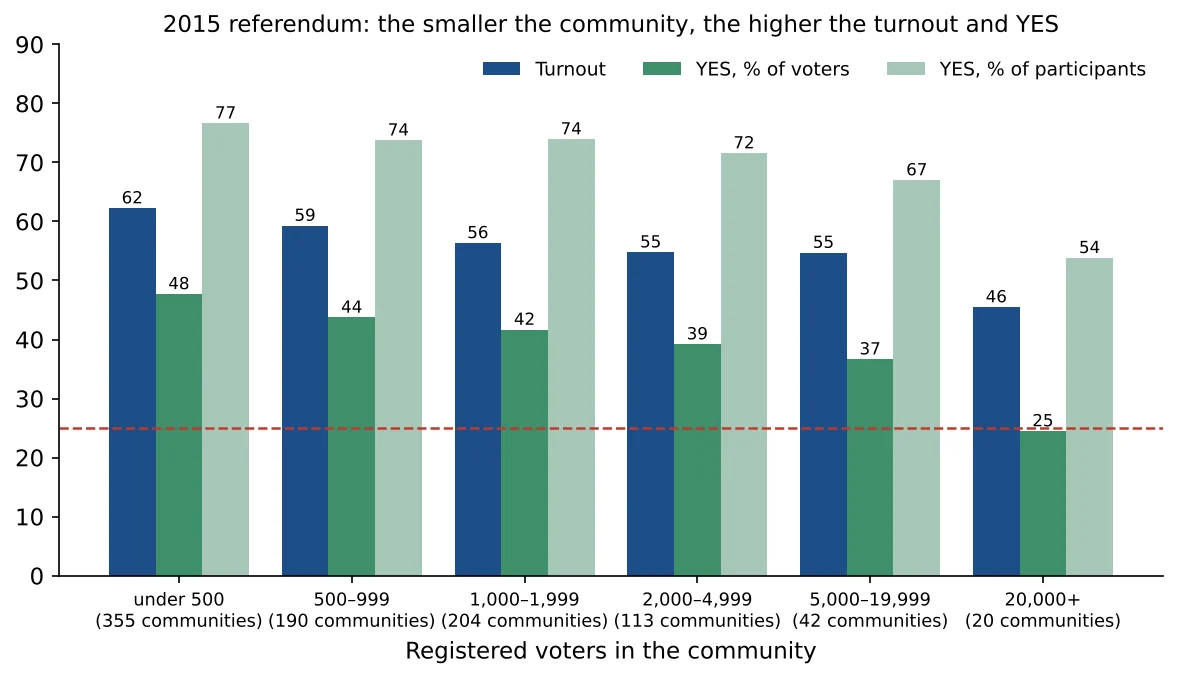 Armenia 2015 Referendum: 134 Communities Where YES Fell Short of a Quarter of VotersIn 134 communities with 40% of Armenia’s voters, YES did not reach a quarter of the electorate; in the 20 largest cities and districts together it reached only 24.5%.With charts explained: 1 charts
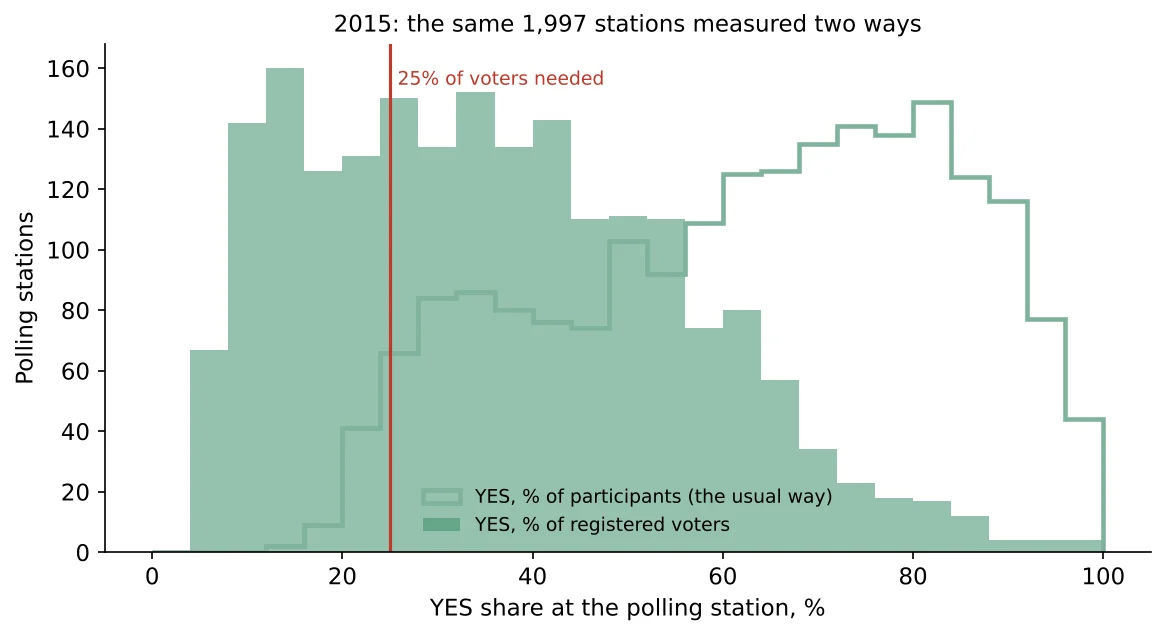 Armenia 2015 Referendum: YES at Each Polling Station as a Share of Voters and of ParticipantsAt 663 polling stations with over a million voters, YES was less than a quarter of the electorate. In the big cities it did not even win a majority of those who voted.With charts explained: 2 charts
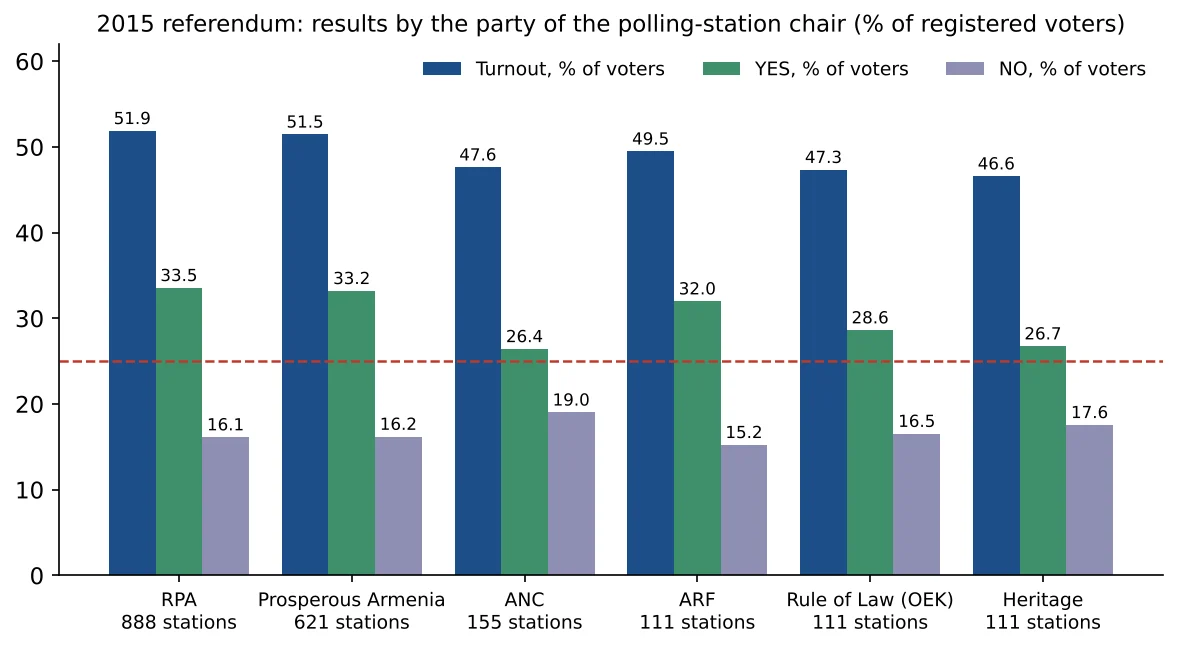 Armenia 2015 Referendum: Results by the Party of the Polling-Station ChairWhere the polling station was chaired by the ruling RPA, YES reached 33.6% of voters; where the chair came from the opposition ANC, 26.4%. NO hardly changed.With charts explained: 1 charts
2013 presidential election
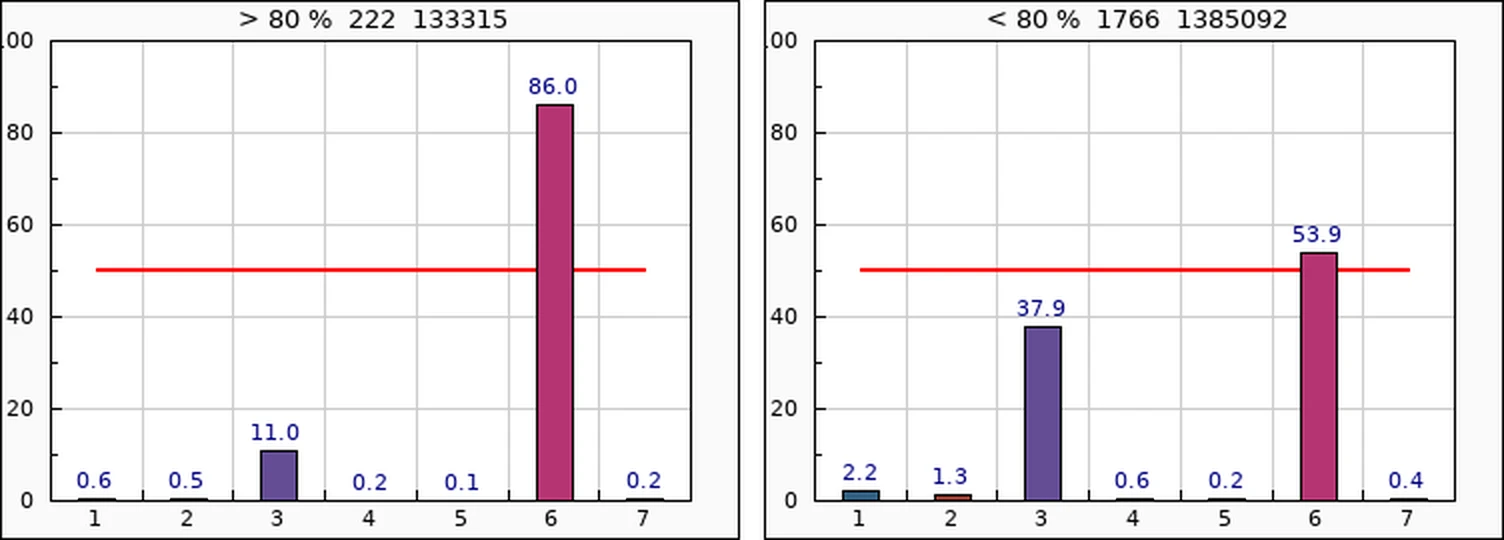 Armenia 2013 Presidential Election: How the Candidates’ Votes Change with TurnoutWhere turnout was below 50%, Raffi Hovhannisyan won 51%. Where it was above 80%, Serzh Sargsyan won 86%. In the lower-turnout half of the vote Hovhannisyan was ahead.With charts explained: 6 charts
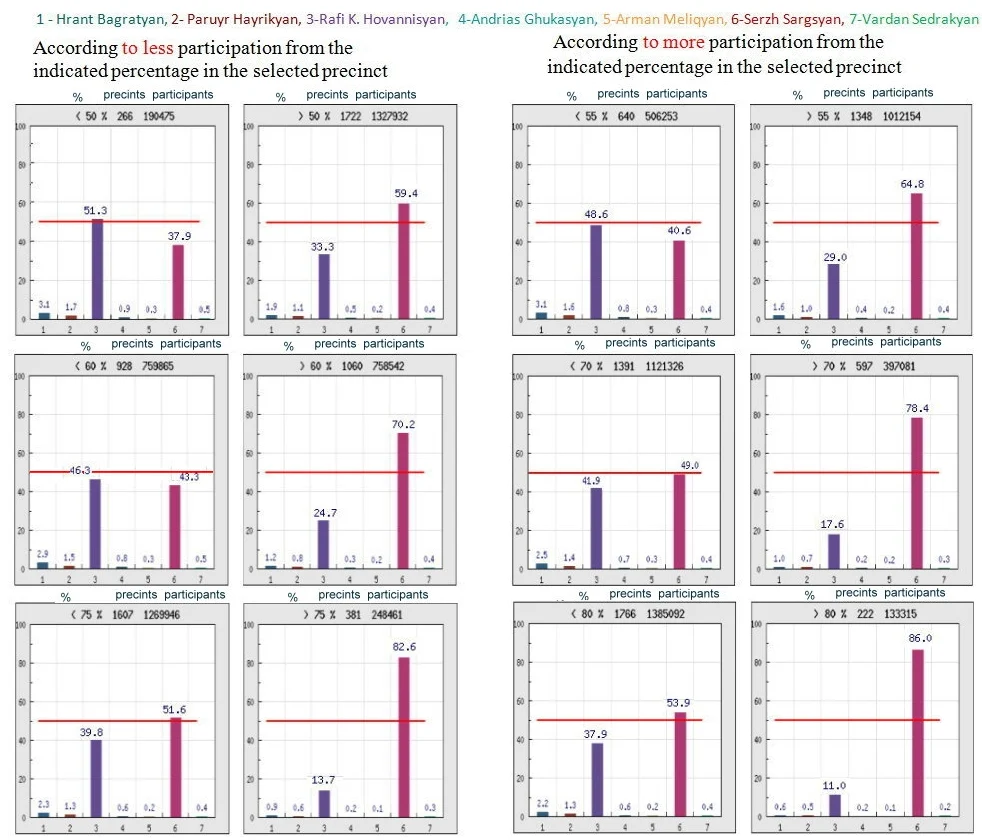 Armenia 2013 Presidential Election: Population, Voters and Votes by TurnoutIn the 928 precincts with turnout under 60%, Serzh Sargsyan had 43.3% of the vote, short of a first-round win; above 80% turnout he had 86%.With charts explained: 1 charts
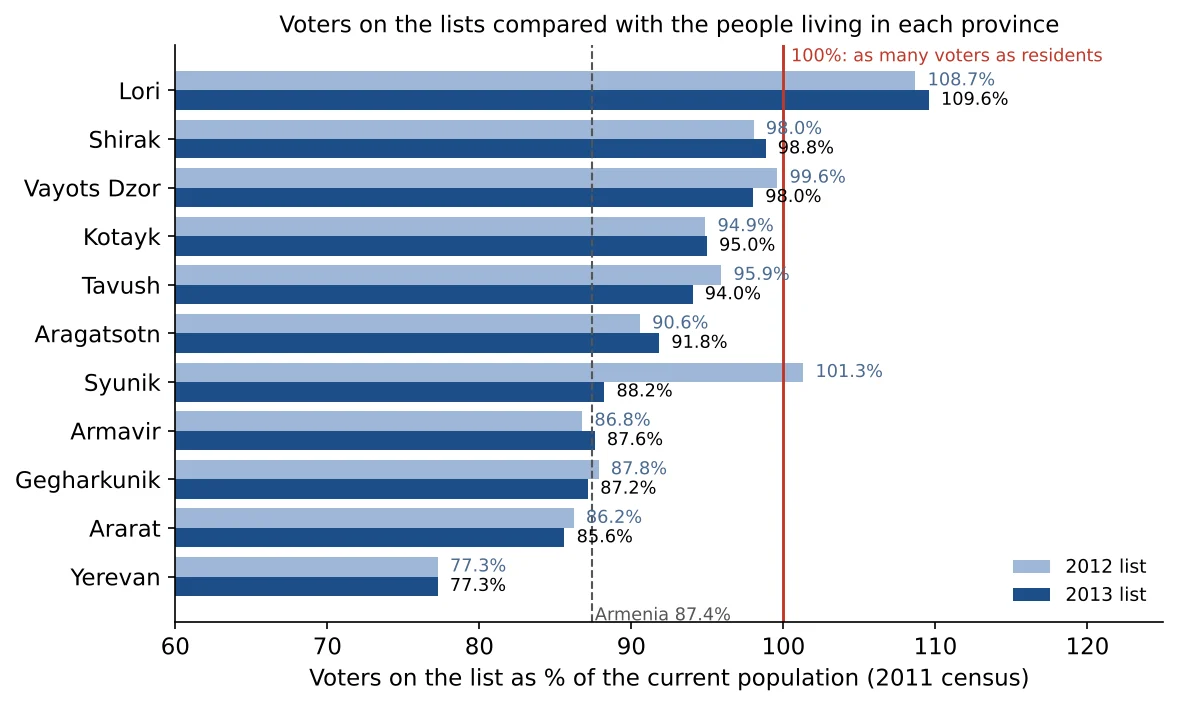 Armenia 2013: Voter Lists vs Population, 2001–2013Between the 2001 and 2011 censuses Armenia lost 194,157 permanent residents, yet its voter list grew by 202,346; in Lori it has more voters than residents.With charts explained: 1 charts
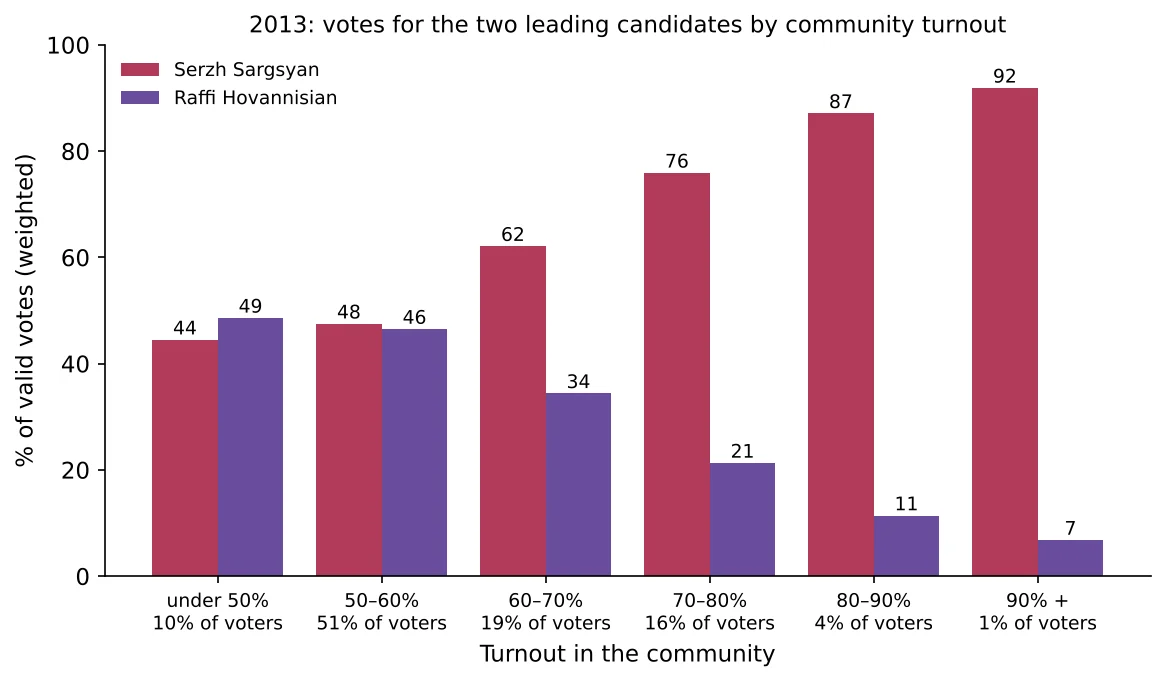 Armenia 2013: Communities Sorted by Turnout, and How Their Votes ChangedIn communities with turnout under 60%, home to 61% of voters, Sargsyan and Hovannisian were practically tied: 47.0% to 46.8%.With charts explained: 1 charts
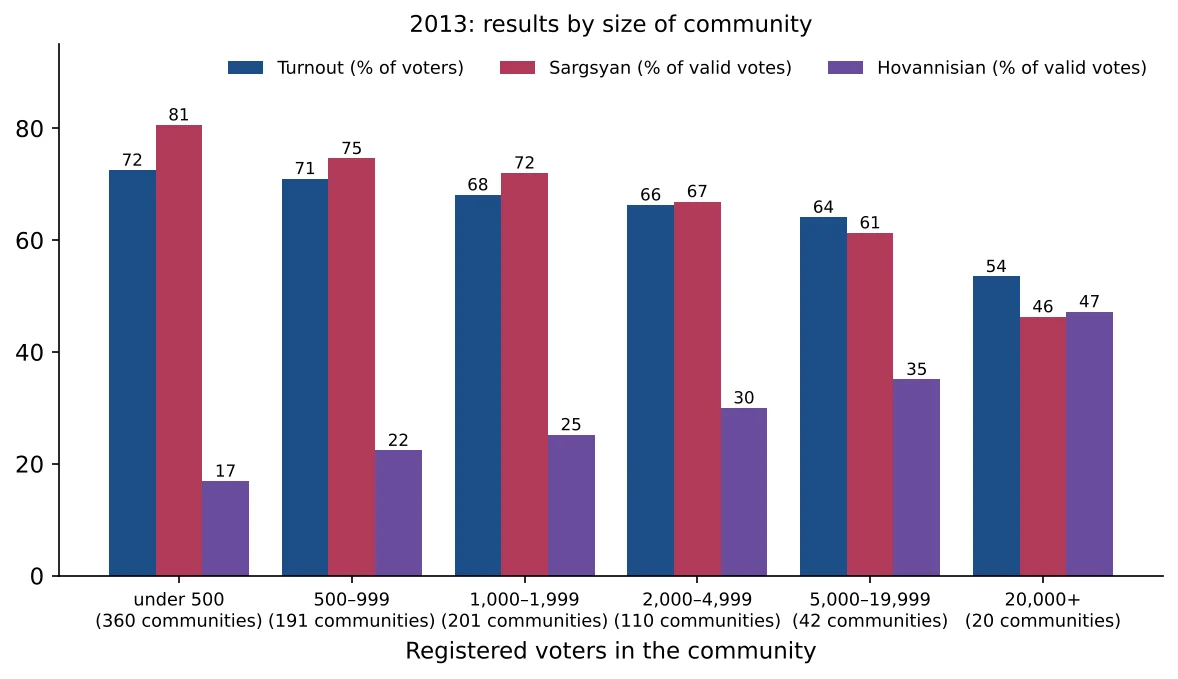 Armenia 2013: The Community Results Table and Where Hovannisian WonIn the 20 largest towns and districts, home to half of the voters, Raffi Hovannisian was ahead; in villages under 500 voters Serzh Sargsyan had 80.6%.With charts explained: 1 charts
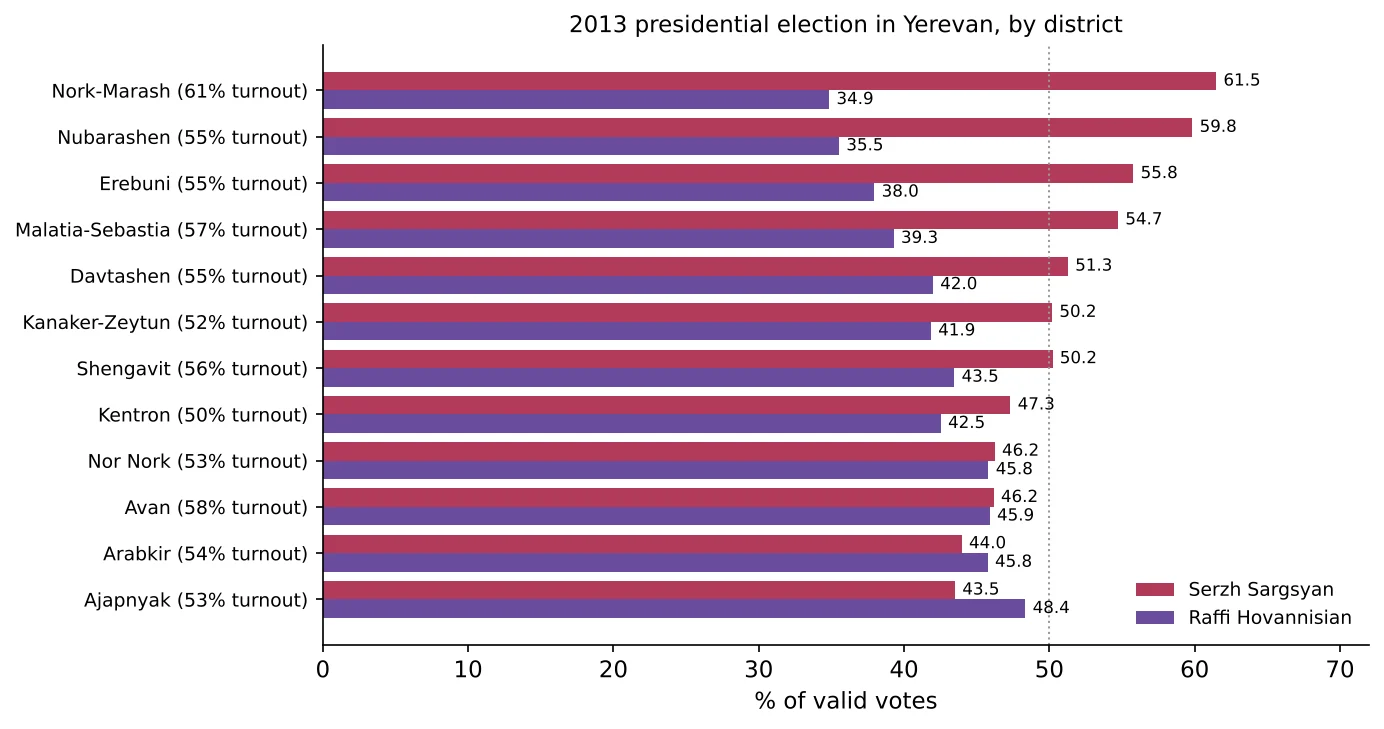 Armenia 2013: Presidential Election Results in Yerevan by DistrictIn Yerevan Serzh Sargsyan received 49.43% of valid votes, less than half; Raffi Hovannisian won the districts of Ajapnyak and Arabkir.With charts explained: 1 charts
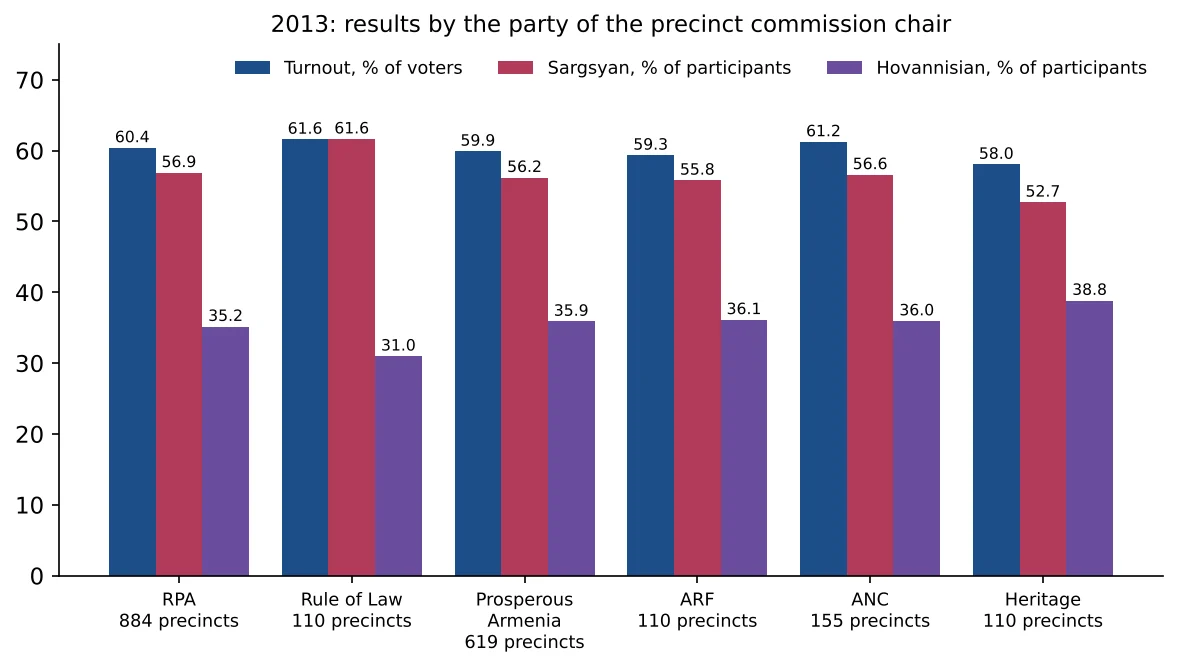 Armenia 2013: Results by the Party of the Precinct Commission ChairSerzh Sargsyan’s share ranged from 52.7% in precincts chaired by Heritage to 61.6% in those chaired by Rule of Law; the chair’s party made only a small difference.With charts explained: 1 charts
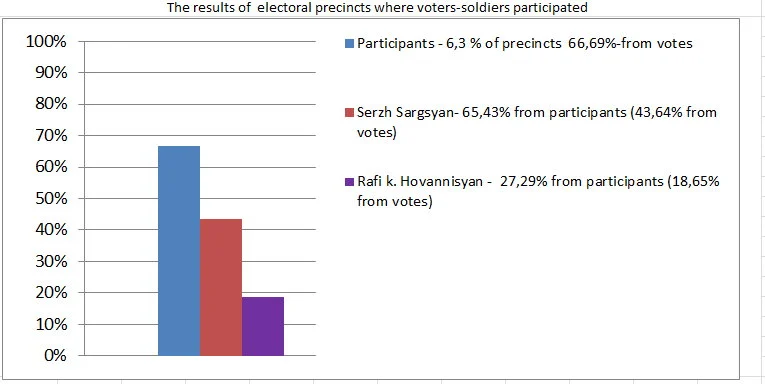
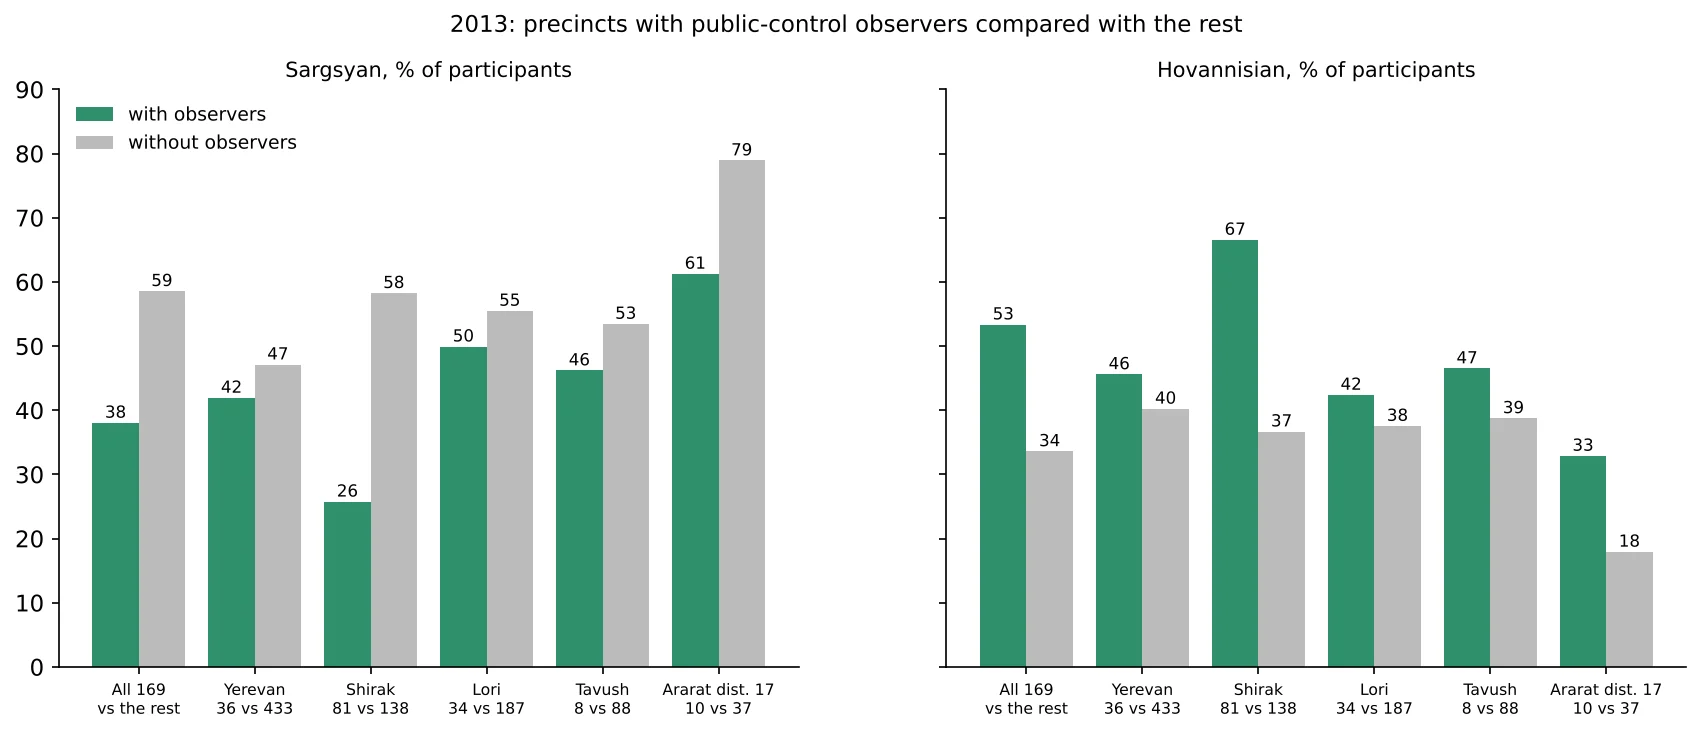 Armenia 2013: Precincts With and Without ObserversWhere civic observers watched the vote, Raffi Hovannisian won with 53.4%; in the rest of the country Serzh Sargsyan had 58.6%.With charts explained: 5 charts
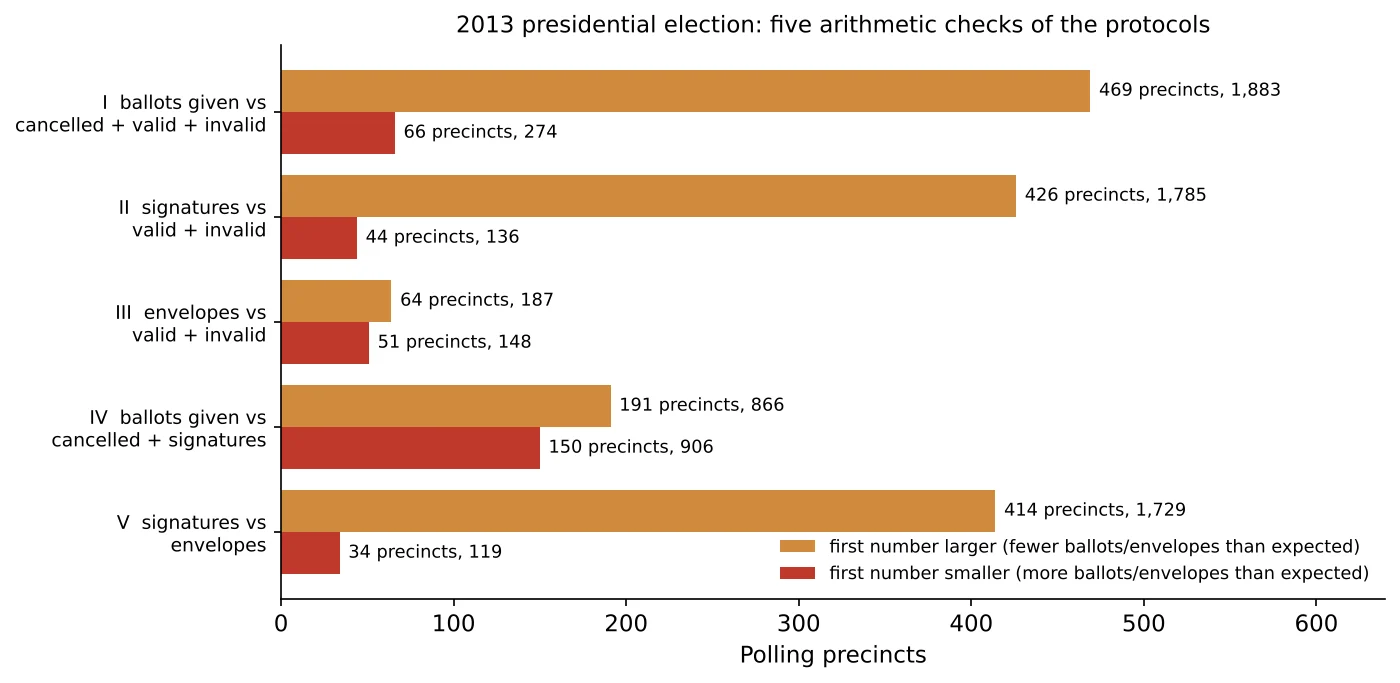 Armenia 2013: 638 Precincts Whose Protocols Do Not Add UpChecking signatures, ballots and envelopes against each other finds mismatches at 638 precincts, totalling at least 3,027, four times the official inaccuracy of 743.With charts explained: 1 charts
 Armenia 2013: The Voting Procedure in the Electoral Code and What It Means for the NumbersEvery step of the voting procedure leaves a count: signatures, stubs, envelopes and ballots. If the law was followed, they agree.With charts explained: 1 charts
2012 parliamentary elections
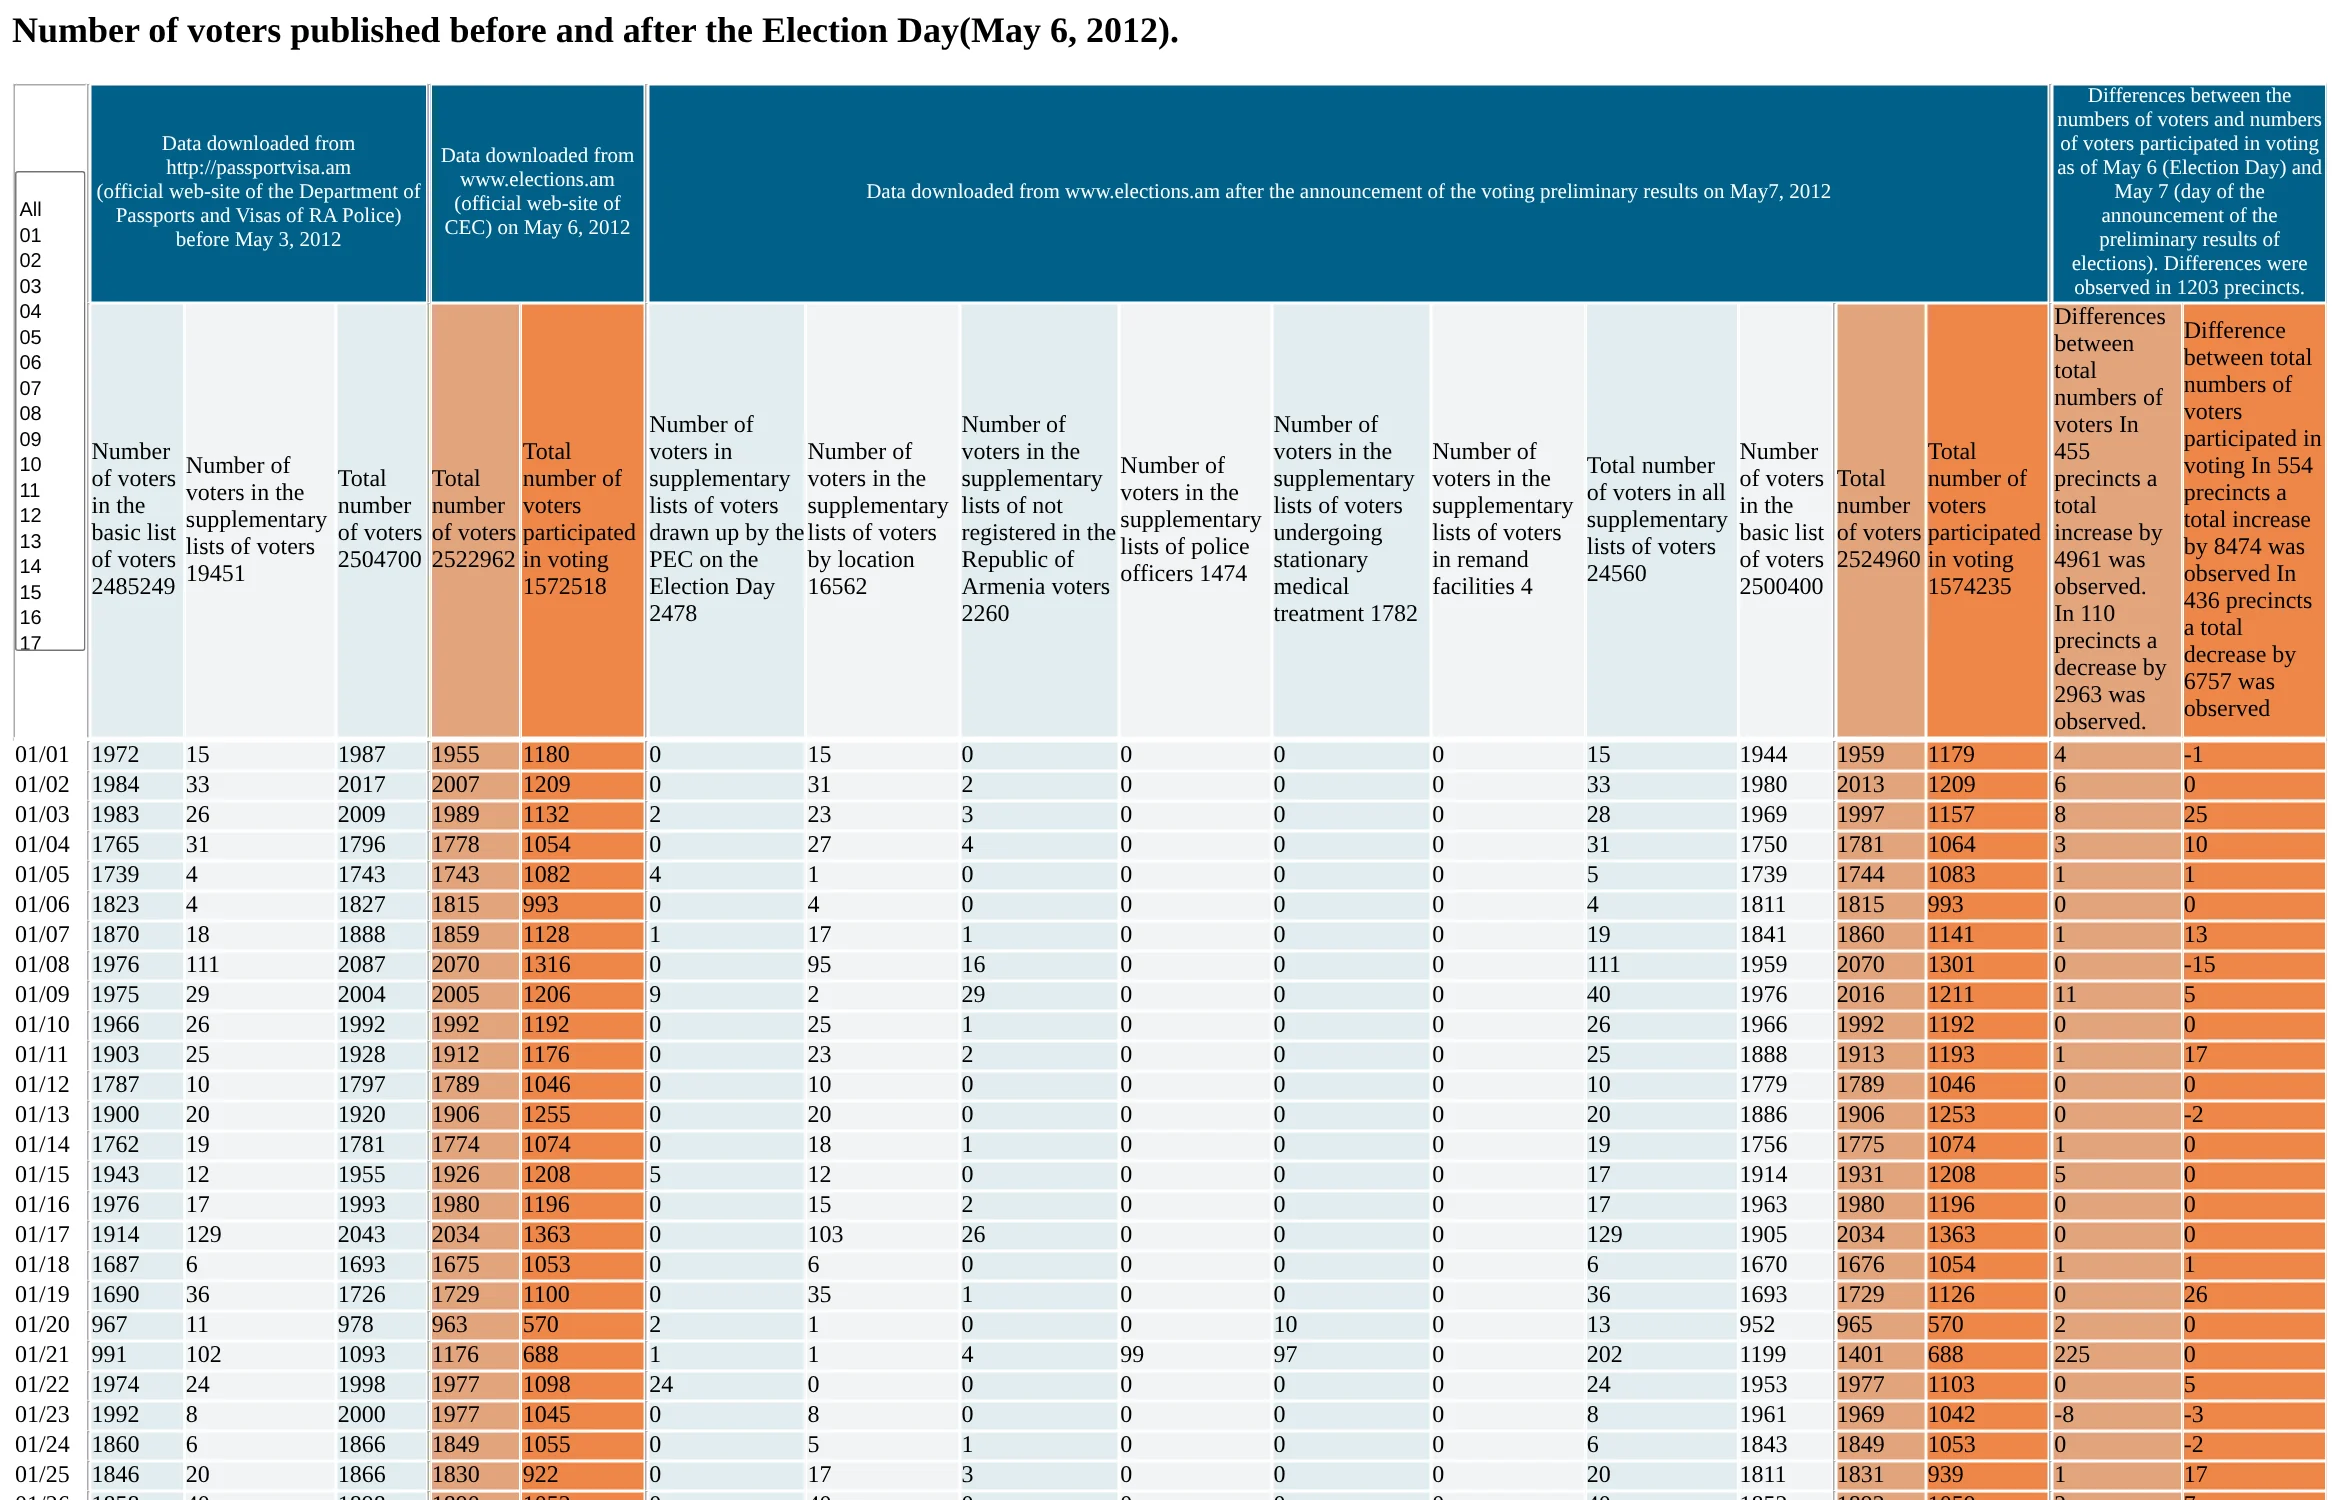 Armenia 2012: Voter Numbers Before and After Election DayIn the last days before the vote the lists gained 18,262 voters. Between election day and the next morning the numbers changed again at 1,203 polling stations.With charts explained: 1 charts
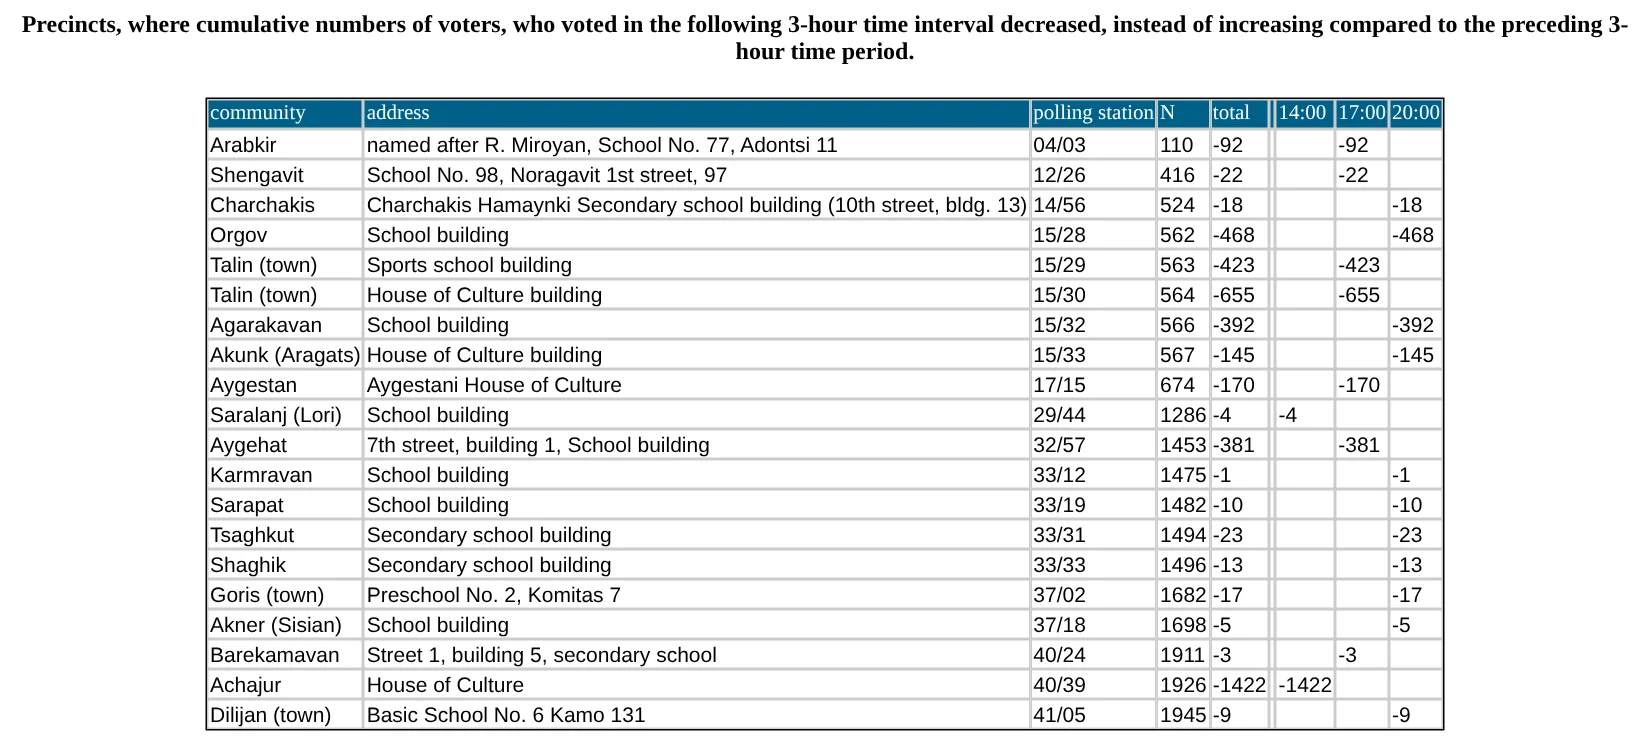 Armenia 2012: 20 Polling Stations Where the Turnout Count Went DownAt 20 polling stations the official turnout fell between two reports, by 4,273 people in total. In Achajur it fell by 1,422 in three hours.With charts explained: 1 charts
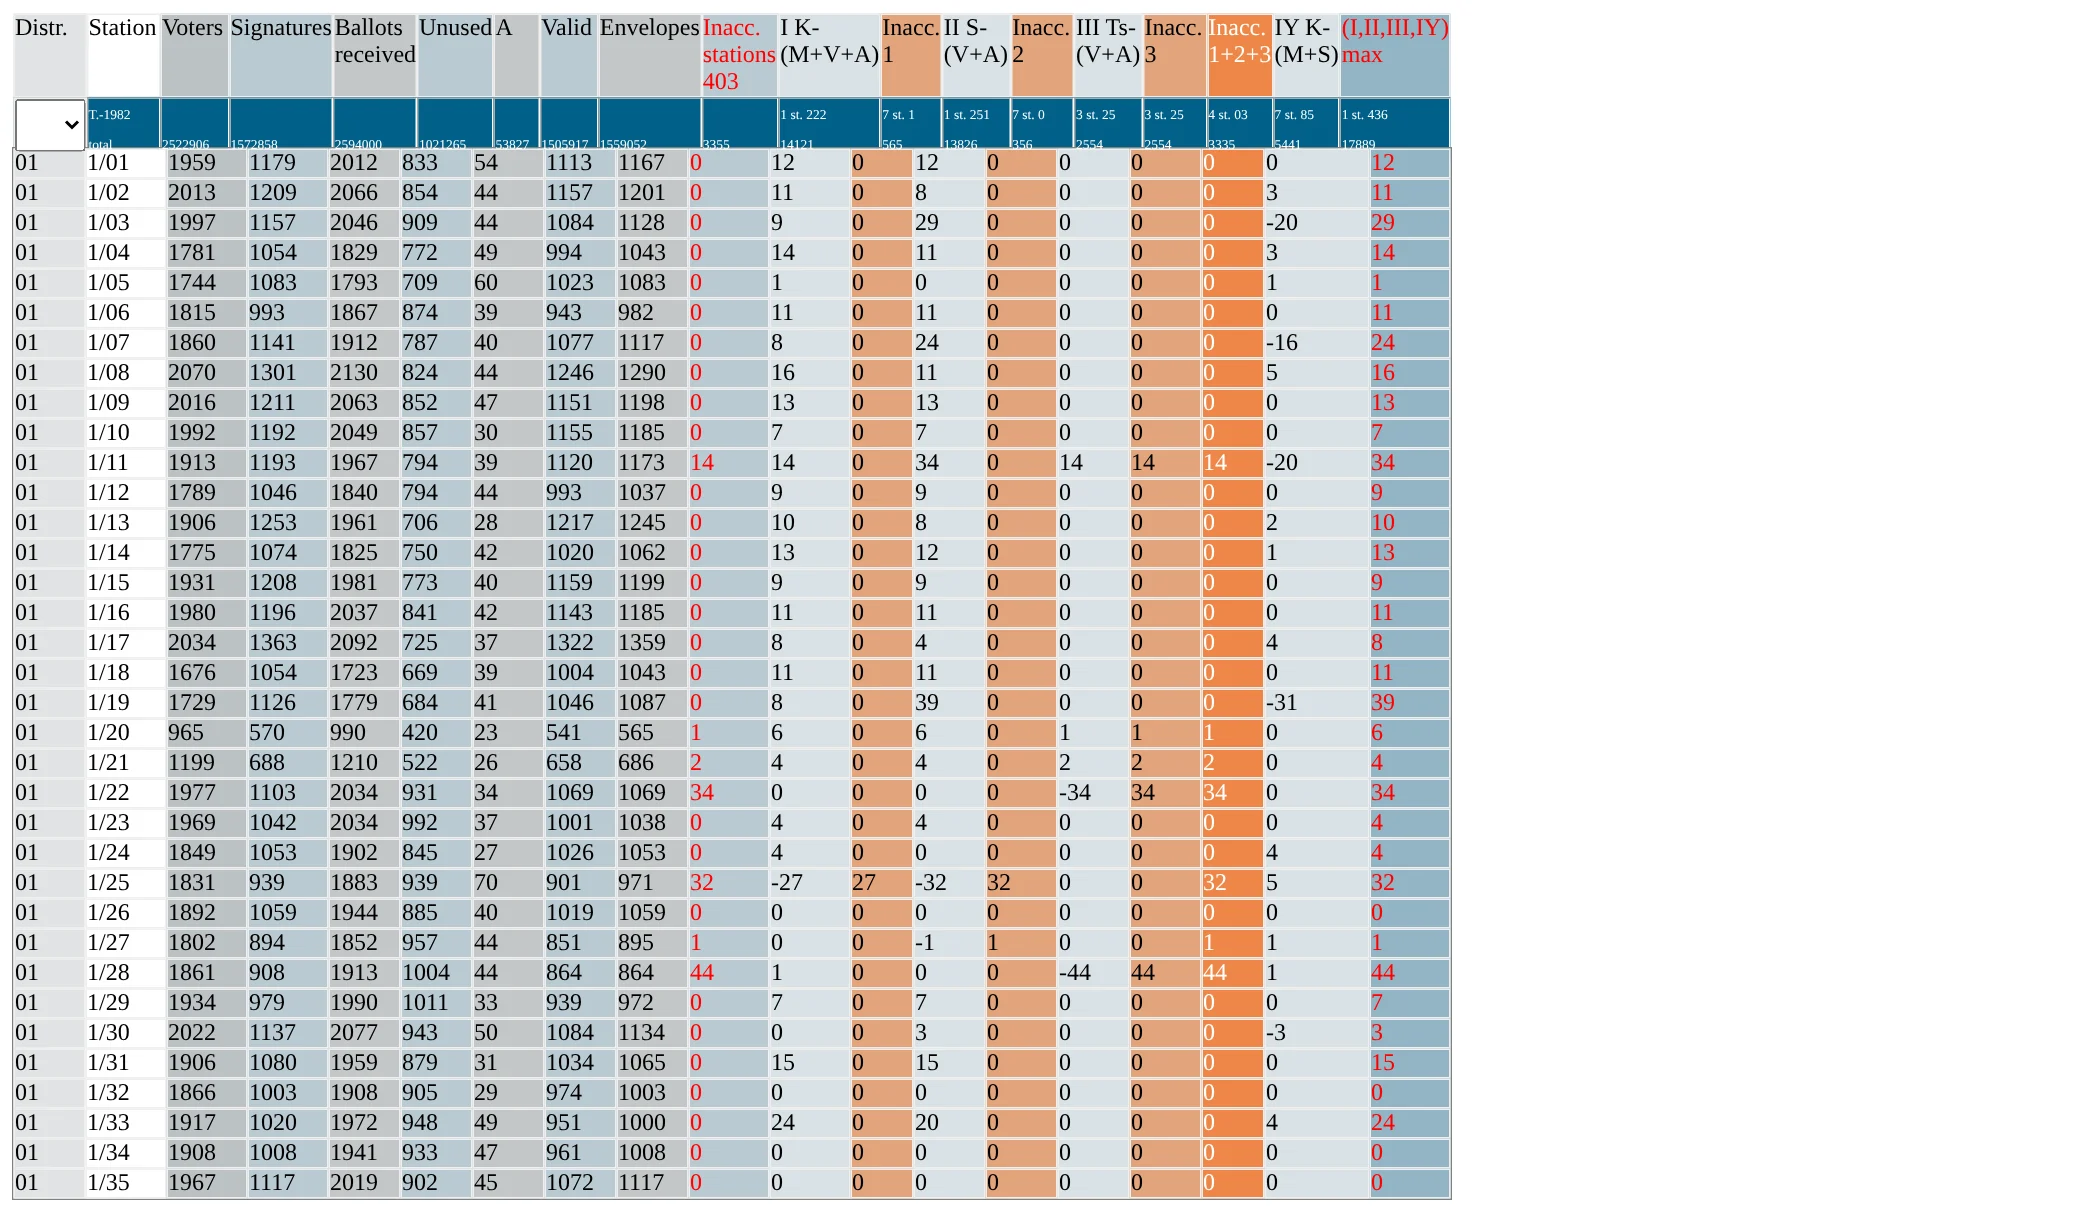 Armenia 2012: Mismatched Numbers at 1,436 of 1,982 Polling StationsBallots, signatures and envelopes failed to match at 1,436 of 1,982 polling stations. The law counted only 3,335 of the at least 17,889 doubtful ballots.With charts explained: 1 charts
- Armenia 2012 Parliamentary Elections: Six Conclusions from the Electronic MonitoringToo many voters, impossible speeds, counts that went down, mismatches at 1,436 stations, 3.42% invalid ballots: the six findings of the first electronic monitoring.
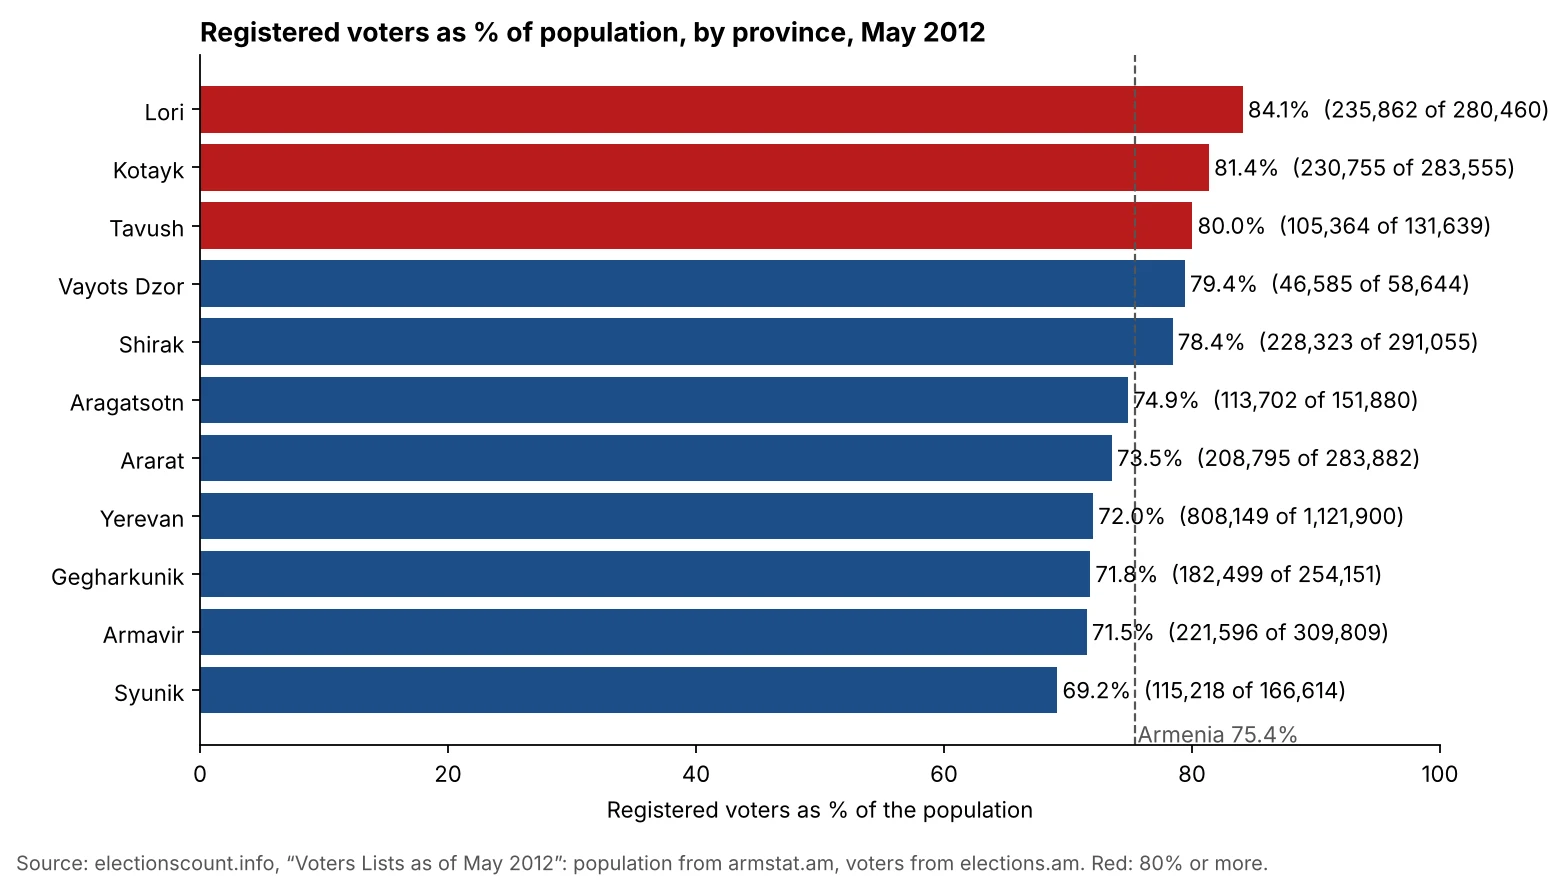 Armenia 2012: Registered Voters Compared with the Population, by Province and Yerevan DistrictIn May 2012 three of every four residents of Armenia were on the voter lists, and in Lori more than five of every six.With charts explained: 2 charts
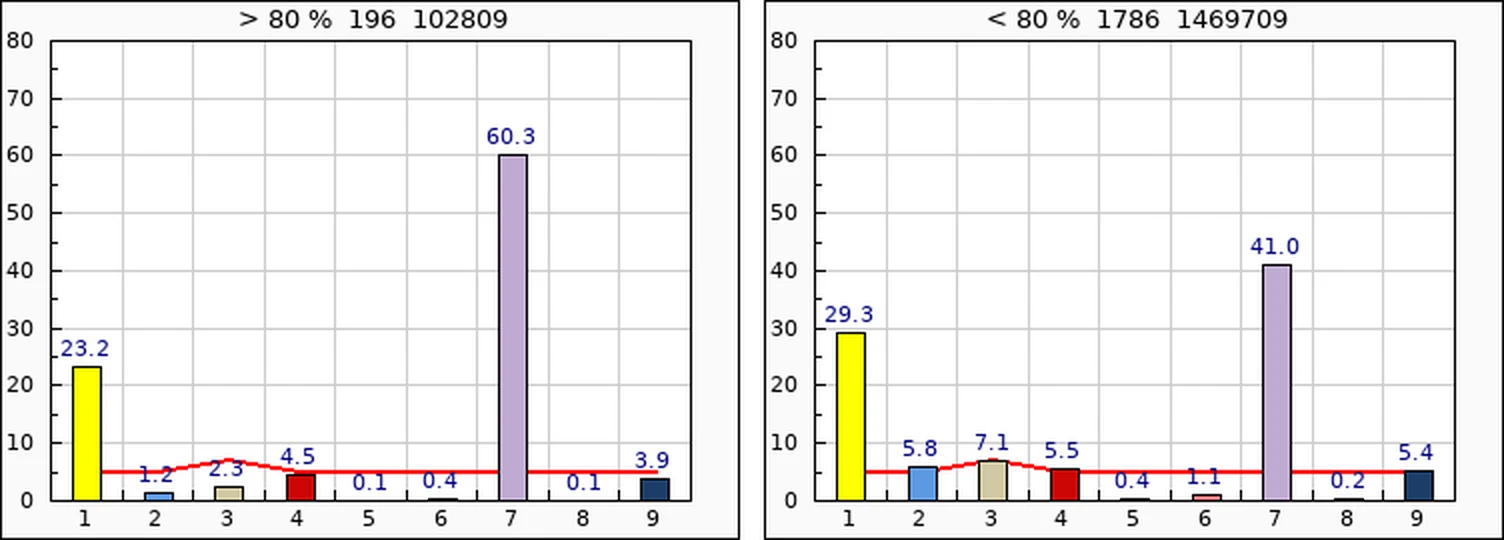 Armenia 2012: The Higher the Turnout, the Higher the Ruling Party's ShareWhere turnout was under 50%, the Republican Party got 31%. Where it was over 80%, it got 60%, and the opposition almost vanished.With charts explained: 5 charts
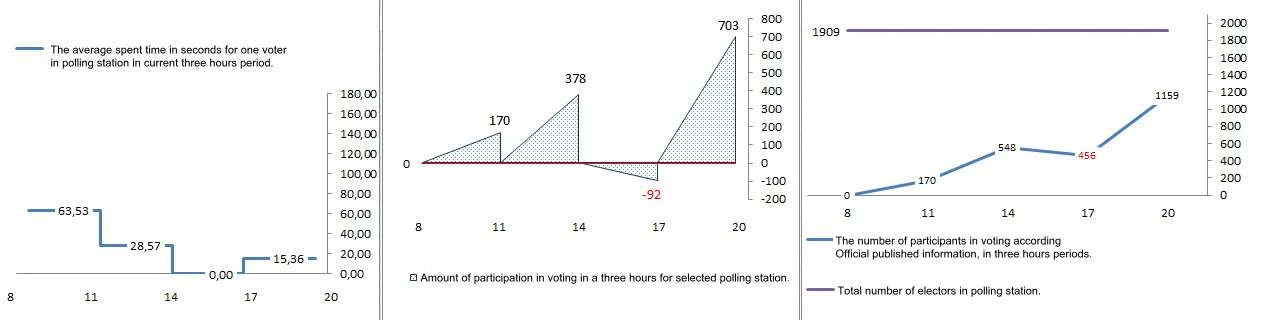 Armenia 2012: Two Yerevan Polling Stations Where the Turnout Count Fell, Chart by ChartIn Arabkir and Shengavit the count fell in the afternoon and then rose by 618–703 voters in three hours, one every 15–17 seconds.
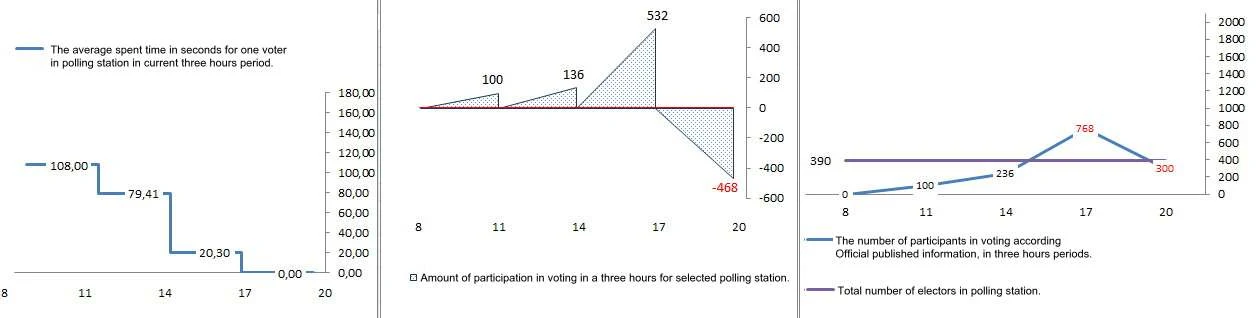 Armenia 2012: Talin, Orgov, Agarakavan and Akunk, Five Polling Stations Where Turnout Was RewrittenOrgov reported 768 voters for a list of 390; a Talin station went from 665 to 10 to 1,028. Five stations in one area account for almost half of all 2012 decreases.
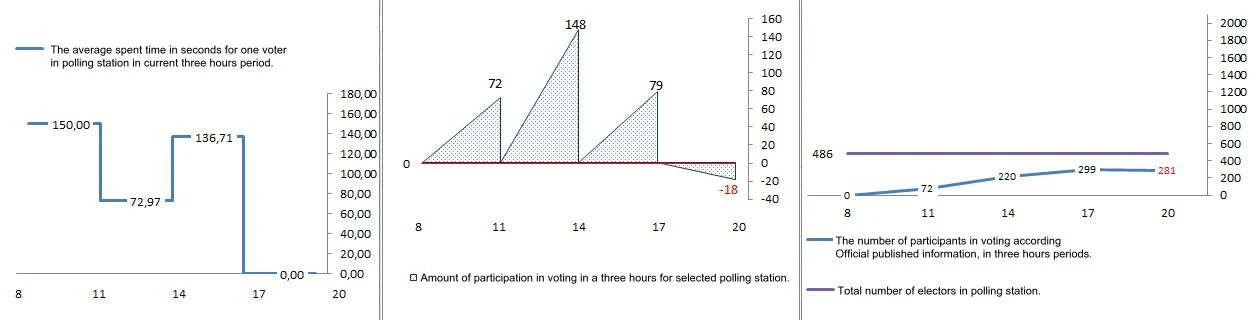 Armenia 2012: Charchakis and Aygestan, Turnout That Went Down and Up AgainIn Aygestan the count fell by 170 in the afternoon, then rose by 717 in the last three hours. In Charchakis the final count was lower than at 17:00.
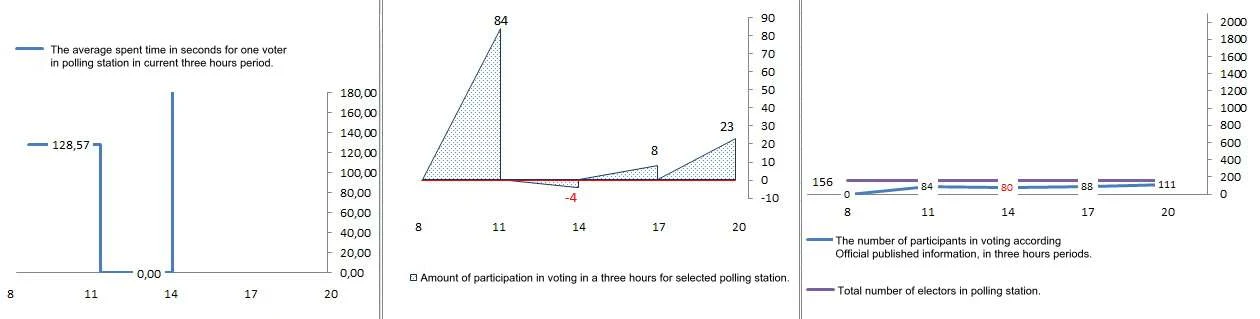 Armenia 2012: Six Village Polling Stations Where the Turnout Count FellAygehat reported 520 voters for a list of 230. In the other five villages the final count was 1 to 23 lower than the count three hours earlier.
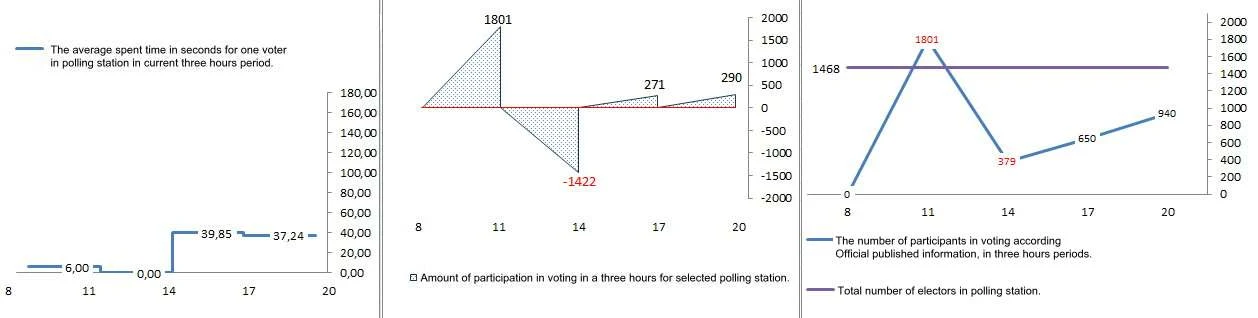 Armenia 2012: Achajur, Goris, Akner, Barekamavan and Dilijan, Turnout Charts ExplainedBy 11:00 Achajur reported 1,801 voters for a list of 1,468, one every 6 seconds. Three hours later the count was 379.
2009 Yerevan council election (from the 2010 book)
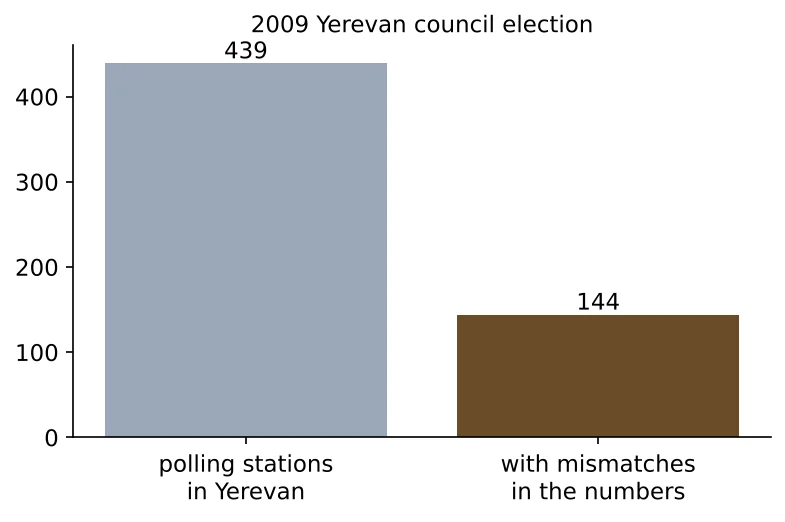 Armenia 2009: The First Yerevan Council Election and What Followed
2008 presidential election (from the 2010 book)
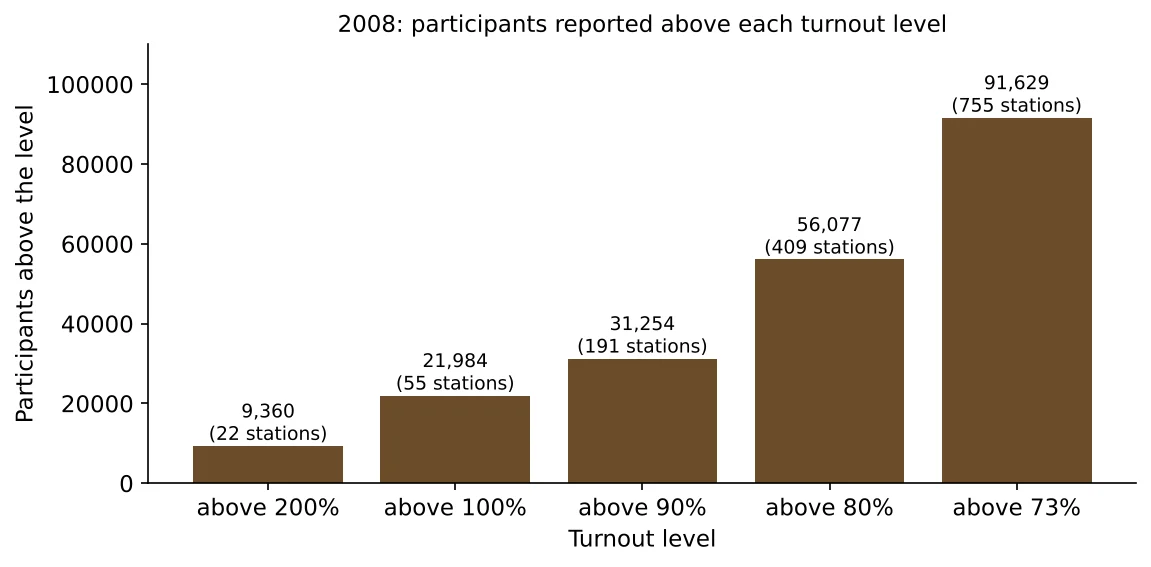 Armenia 2008 Presidential Election: Turnout Above 100%, and Above 200%At 22 polling stations more than twice as many people voted as were on the list. At about 635 stations participation exceeded the voters available by 78,957.With charts explained: 1 charts
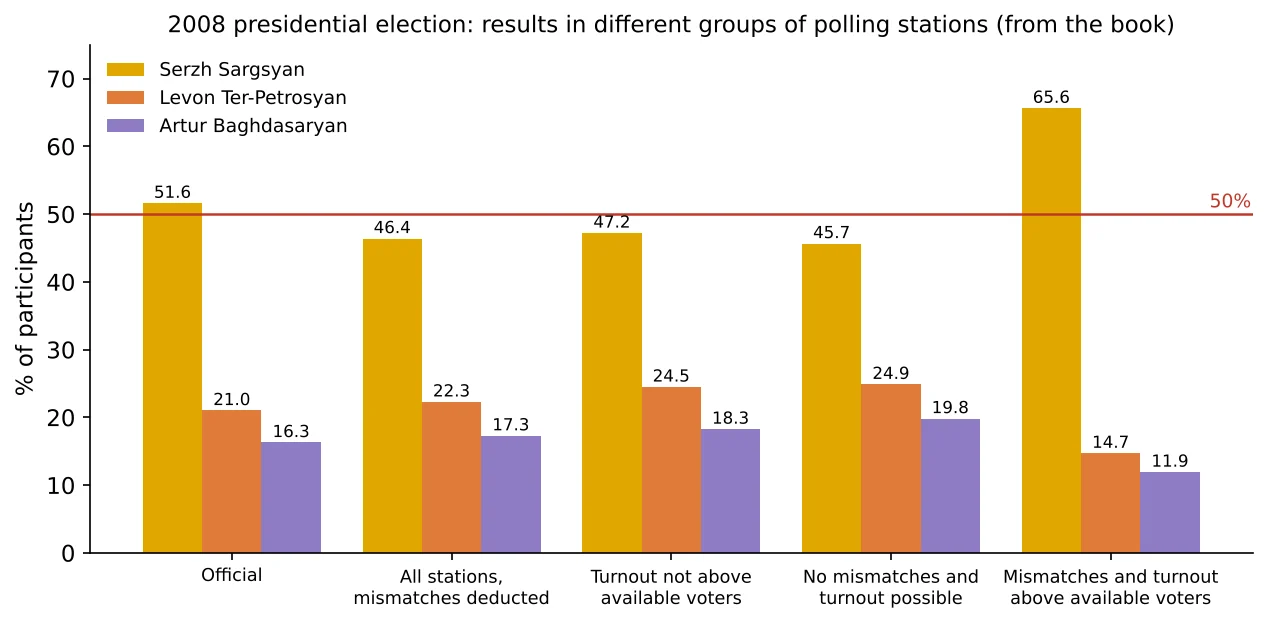 Armenia 2008 Presidential Election: Results Without the Suspect Polling StationsOfficially the winner had 51.6% of participants. At polling stations without mismatches and with possible turnout, he had 45.7%, short of a first-round win.With charts explained: 1 charts
2007 parliamentary elections (from the 2010 book)
 Armenia 2007: Weak Points in the Electoral Code Before the Parliamentary ElectionsOne precinct seal for two places at once, protocols that can be “corrected” after the count, and no rule for when inaccuracies change the seat allocation.With charts explained: 1 charts
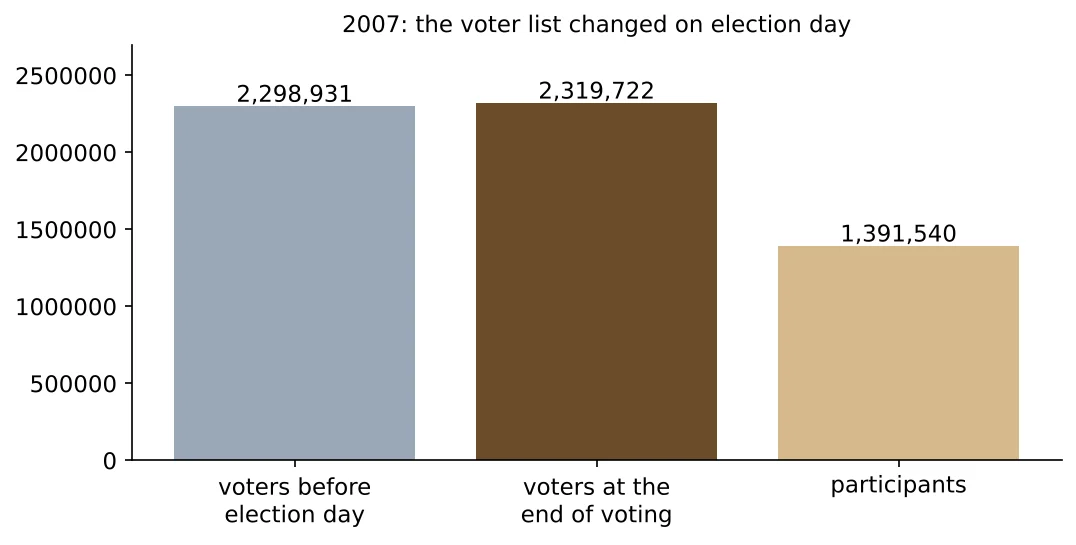 Armenia 2007 Parliamentary Elections: Voter Lists That Changed on Election DayDuring election day the national voter list grew by 20,791. At 49 stations more people voted than had been on the list the day before.With charts explained: 2 charts
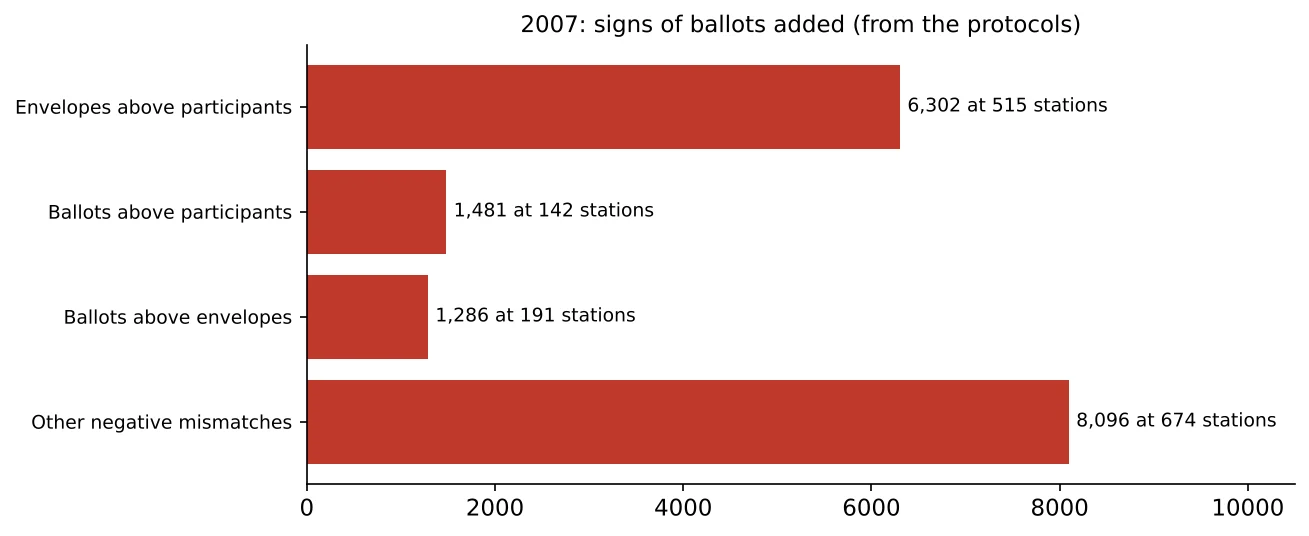 Armenia 2007 Parliamentary Elections: Mismatches at 1,310 Polling StationsAt 515 stations the boxes held 6,302 more envelopes than people who voted.With charts explained: 2 charts
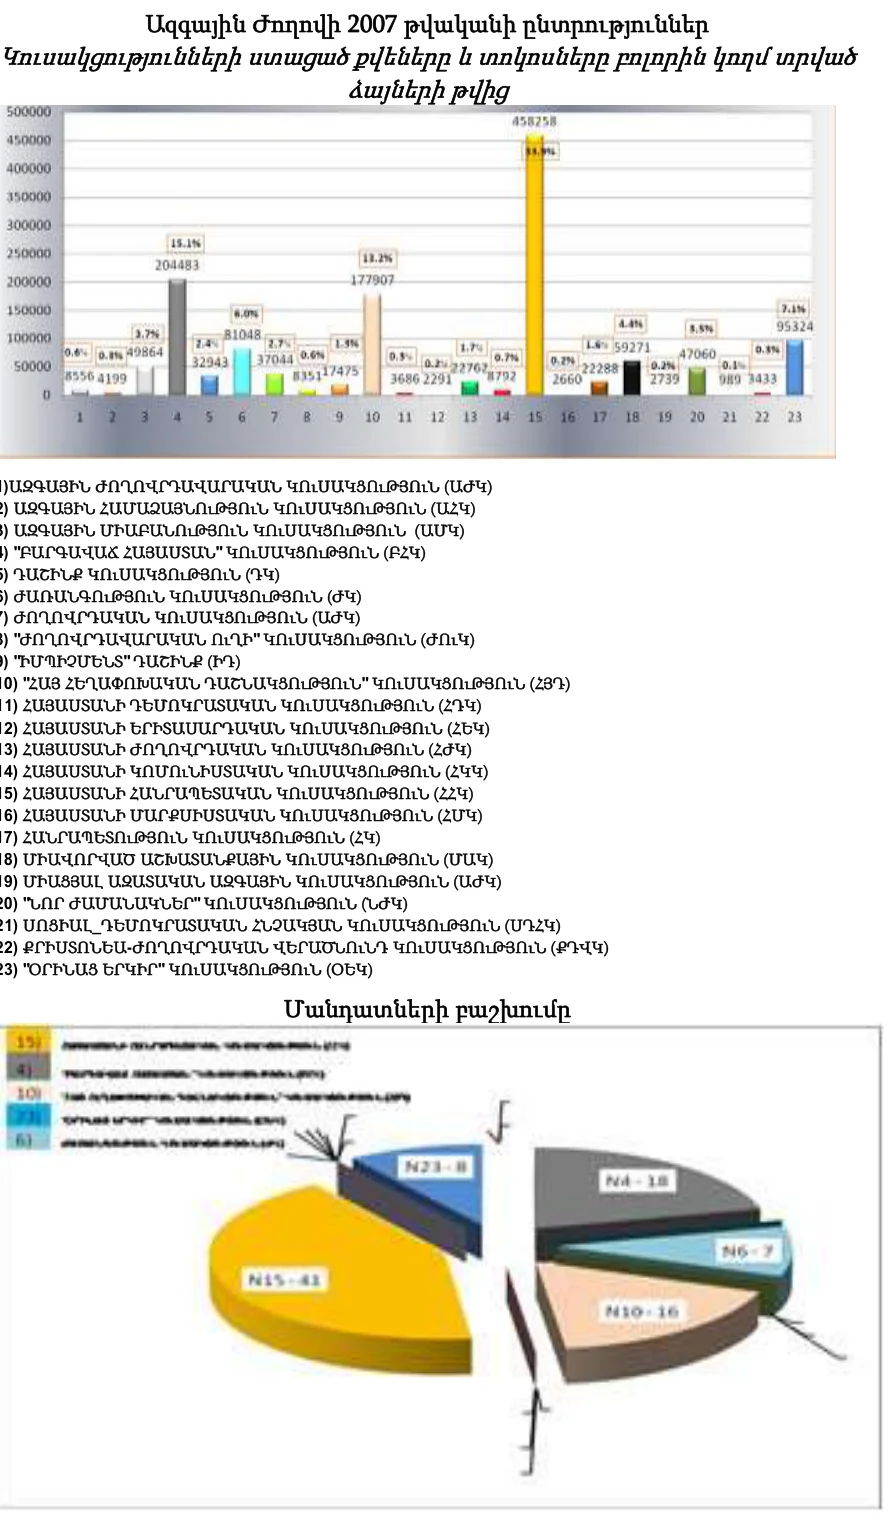 Armenia 2007: How 14,665 Inaccuracies Could Change Who Entered ParliamentOne party missed the 5% threshold by 9,033 votes; the commissions recorded 14,665 inaccuracies. An error of only 664 votes would have moved a seat.With charts explained: 1 charts
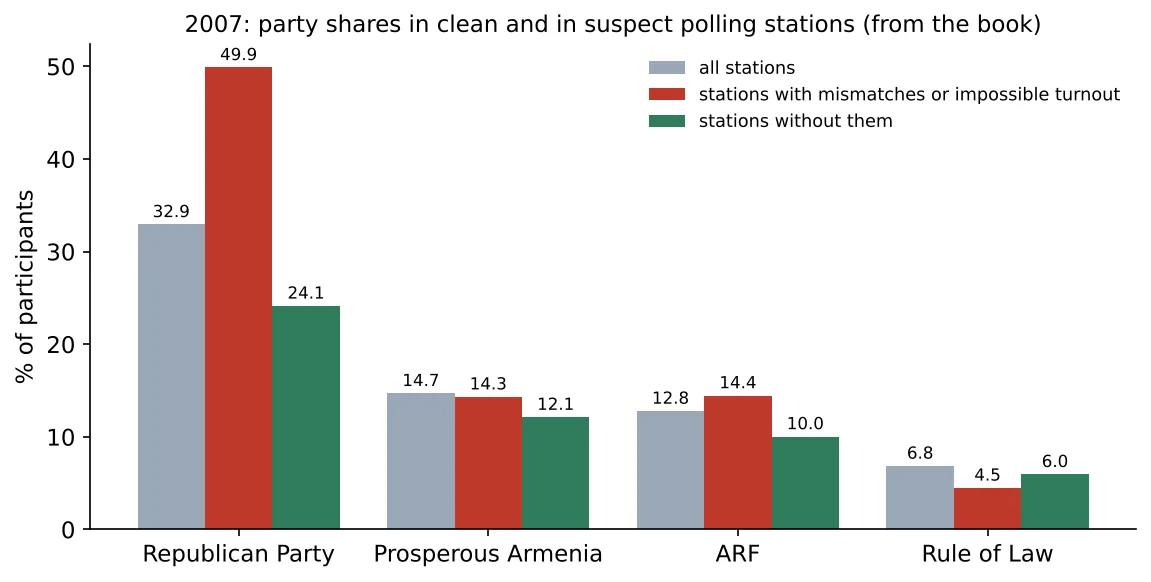 Armenia 2007: Parliament Seats From Clean and From Suspect Polling StationsIn polling stations without mismatches or impossible turnout the Republican Party had 24%; in the others, 50%. Of the 90 party-list seats, 38 came from the suspect results.With charts explained: 2 charts
2005 referendum and local elections (from the 2010 book)
- Armenia 2005: The Electoral Code Amendments and What They Left OpenThe 2005 amendments added numbered ballot stubs and three-hourly turnout reports, but kept military voter lists secret and the commissions dependent on the President.With charts explained: 1 charts
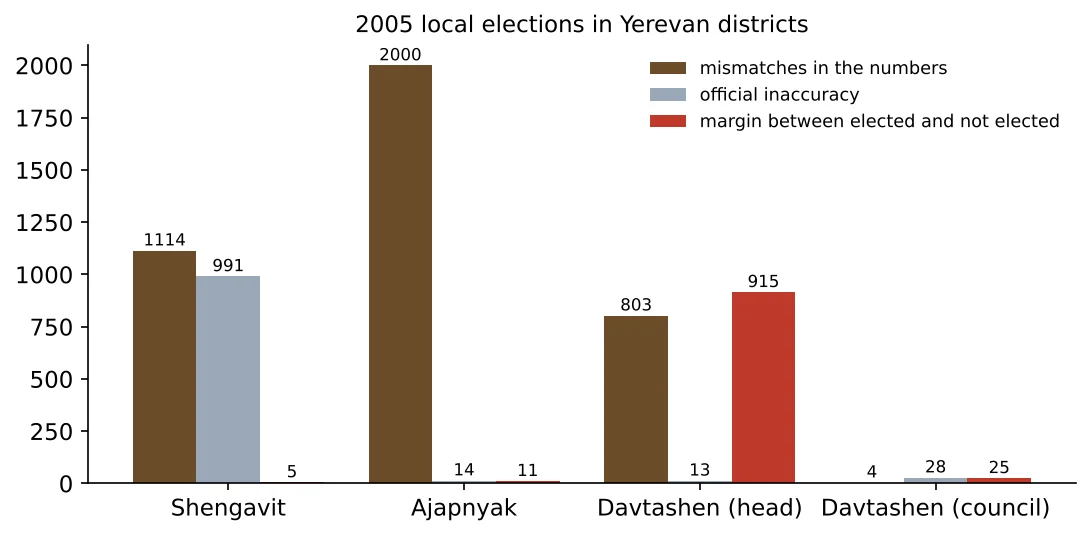 Armenia 2005 Local Elections: Yerevan Districts Where Inaccuracies Exceeded the MarginIn Shengavit the last elected and first unelected council candidates were 5 votes apart; the numbers contained 1,114 inaccuracies. The commission annulled the election; a court restored it.With charts explained: 1 charts
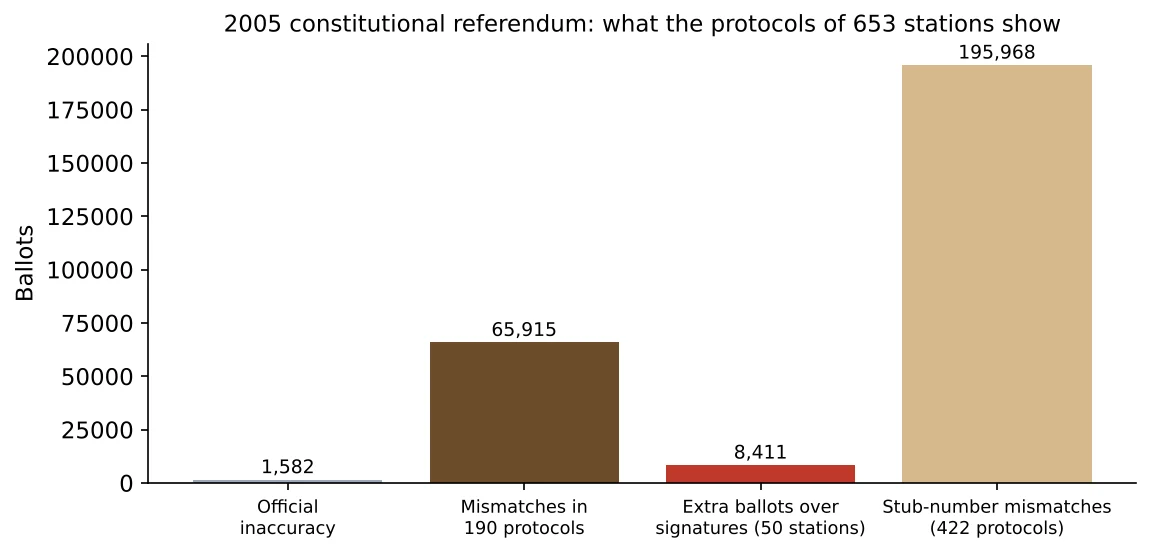 Armenia 2005 Constitutional Referendum: What 653 Protocols ShowAt station 12/5 in Yerevan the commission recorded an inaccuracy of 4.08, a fraction of a ballot. At 50 stations the boxes held 8,411 more ballots than voters had signed for.With charts explained: 1 charts
2003 presidential and parliamentary elections (from the 2010 book)
 Armenia 2003 Presidential Election: Turnout That Fell After the Polls ClosedAfter voting ended, the reported turnout in Yerevan’s Avan district fell from 62.44% to 56.86%. Participants cannot disappear once they have voted.With charts explained: 1 charts
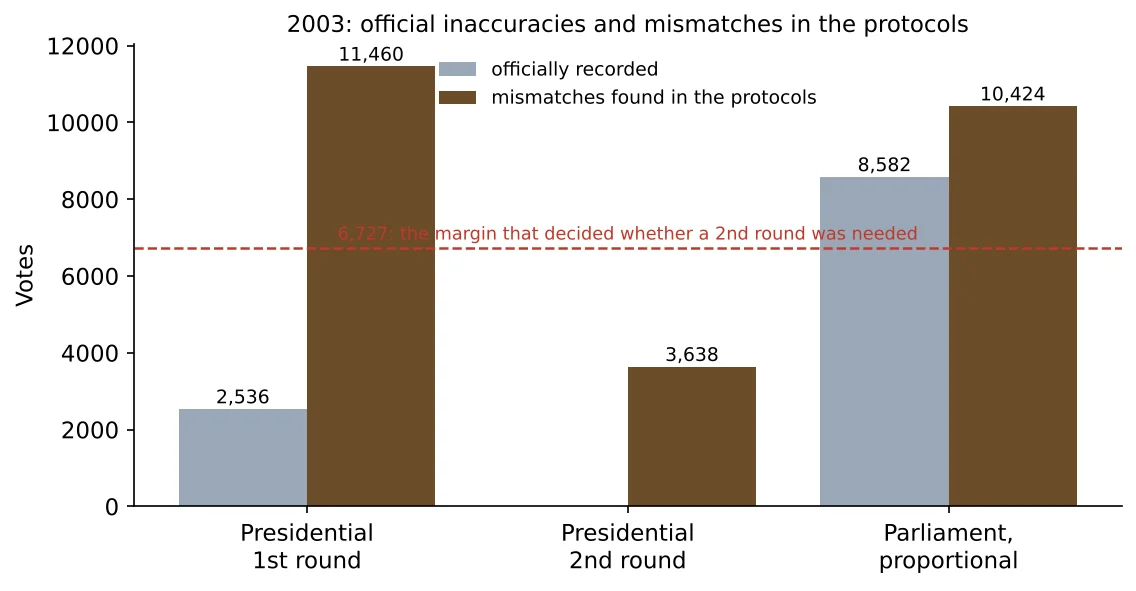
- Armenia 2003 Presidential Election: 6,727 Votes From a First-Round Win, 11,460 InaccuraciesThe leader needed 6,727 more votes to win in the first round. The protocols contained 11,460 inaccuracies; the law required the results to be checked.With charts explained: 1 charts
- Armenia 2003 Presidential Run-off: 13,500 More Voters, 132,200 More ParticipantsBetween the two rounds the voter list grew by 0.6%, while the number of participants grew by about 10%.With charts explained: 1 charts
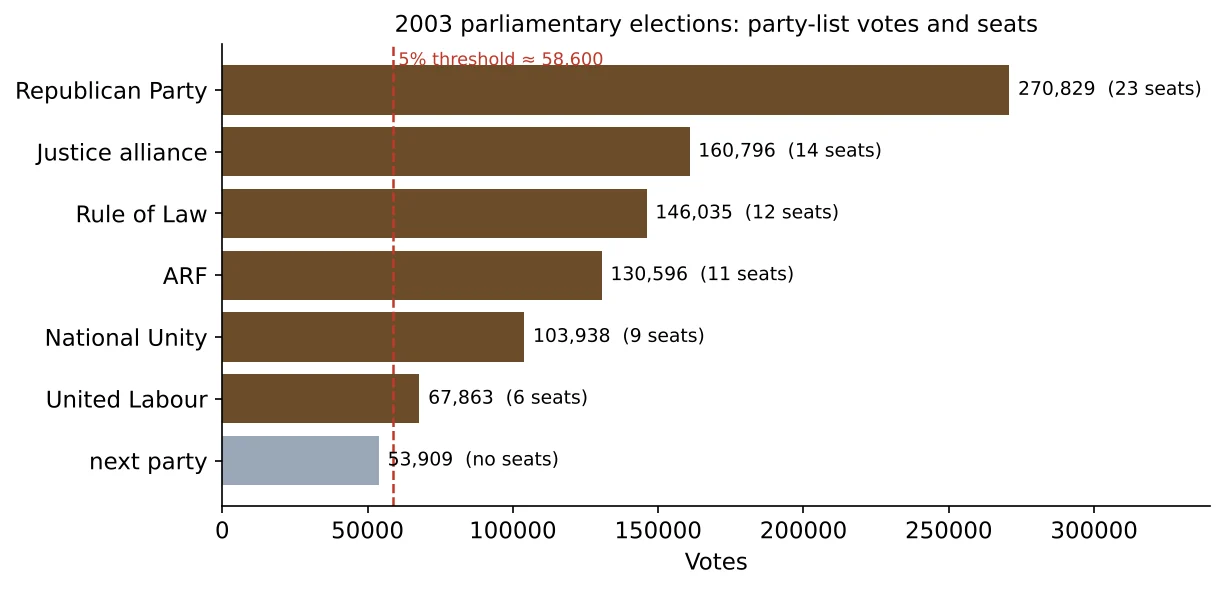 Armenia 2003 Parliamentary Elections: Results, Thresholds and 10,424 InaccuraciesSix parties passed 5%; the seventh was about 4,700 votes short. The protocols contained 10,424 inaccuracies at 587 stations.With charts explained: 1 charts
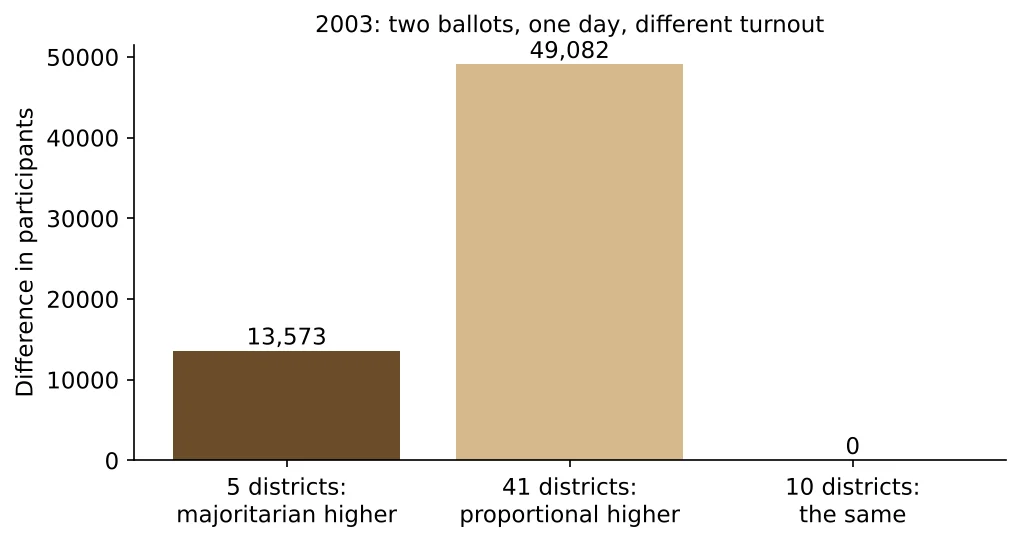 Armenia 2003: Two Ballots, One Day, a Turnout Gap of 62,655The same voters received two ballots at the same table. In 46 of 56 districts the two counts of participants differed, by 62,655 in total.With charts explained: 1 charts
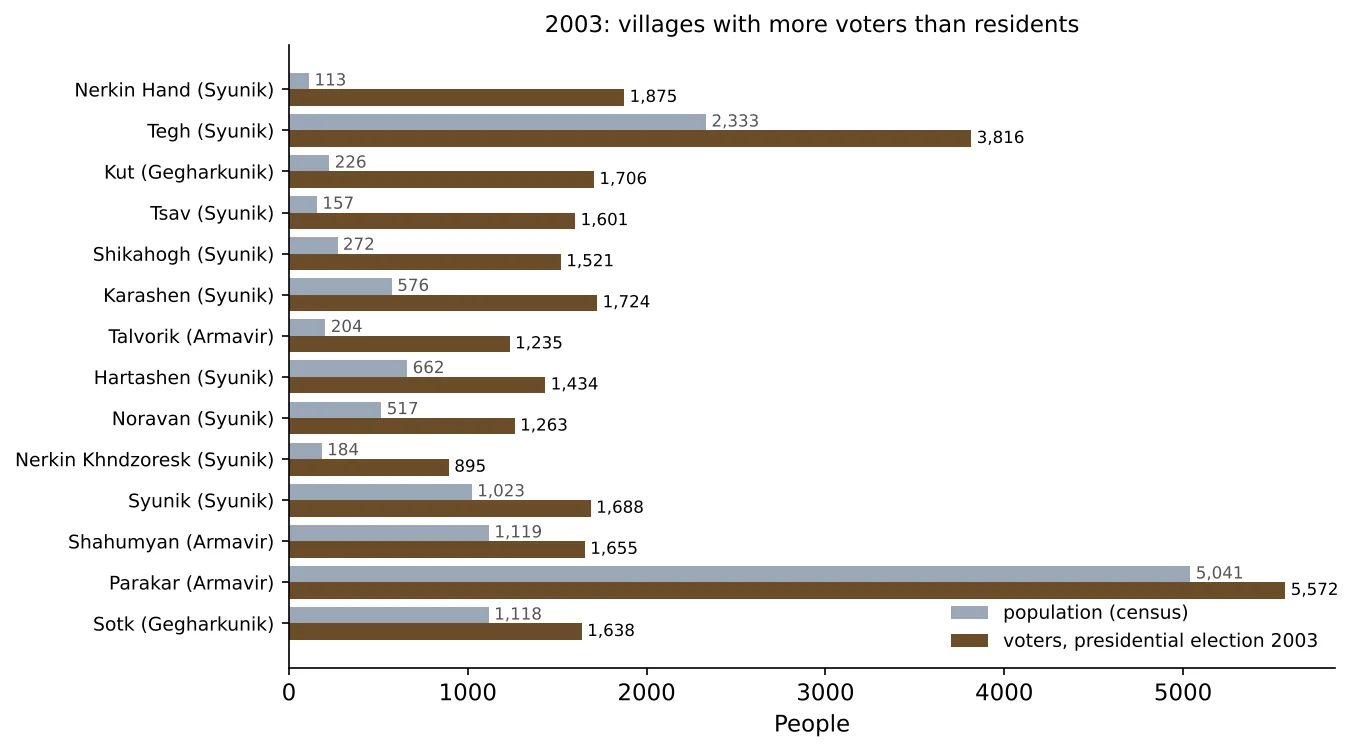 Armenia 2003: Villages With More Voters Than ResidentsNerkin Hand in Syunik had 113 residents and 1,875 voters in the 2003 presidential election; three months later, 79.
Elections from 1995 to 2002 (from the 2010 book)
- Armenia 1995–1996: The First Parliamentary Law and the Elections That FollowedIn the rating vote on electoral systems, a multi-member majoritarian draft won more than 70 votes against about 40, yet only the other draft was put forward.With charts explained: 1 charts
- Armenia 1998–1999: A New Electoral Code, a Snap Presidential Election and a New ParliamentIn 1998 a candidate was elected president although, the book argues, the ten-year residency rule of the Constitution barred him from standing.With charts explained: 1 charts
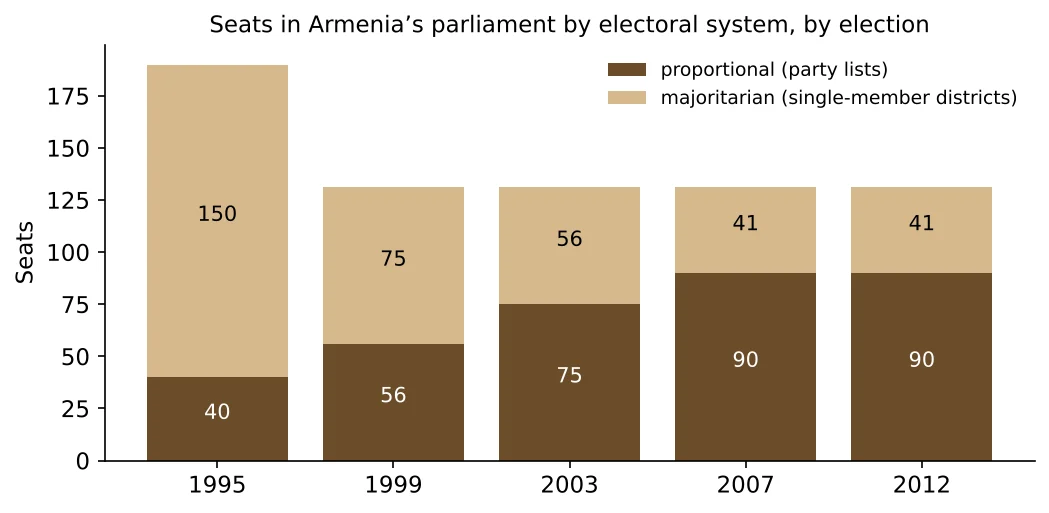
- Armenia 2002: The Electoral Code Behind the 2003 ElectionsThe 2002 code reversed the balance: 75 seats by party list, 56 in districts. The commissions still depended on the president and the parliamentary parties.With charts explained: 1 charts