Armenia 2015 Referendum: YES and NO Above and Below Each Turnout Limit
At polling stations with turnout under 51%, which had 55% of all voters, YES was only 19.5% of registered voters, below the 25% that the draft needed.
Original page on electionscount.info: Distribution of votes by turnout, 2015 (tk=51)Under the rules of the 6 December 2015 referendum on constitutional amendments, the draft was adopted if more than half of the participants voted YES and the YES votes were at least one quarter of all registered voters. The second condition is why the site so often shows YES and NO as a share of voters rather than of participants.
The page “Distribution of votes by turnout, 2015” divides the 1,997 polling stations into two groups at a turnout limit you choose and shows each group as if it were a separate country: its turnout, its YES and its NO, all as a share of the registered voters in that group. The limit is the number after tk= in the address; change it and press View to see a new split. The same tool exists for the 2012 parliamentary election and the 2013 presidential election.
How to read the two panels
- Bar 1 (dark blue): turnout, participants as % of registered voters.
- Bar 2 (green): YES votes as % of registered voters.
- Bar 3 (grey): NO votes as % of registered voters.
- Red line: 25% of registered voters, the least YES the draft needed.
- Left panel: all polling stations whose turnout was at or above the limit (
>=). Right panel: all stations below it (<). On the site itself the two panels are the other way round: “<” on the left, “>=” on the right.
Because every bar is a share of registered voters, you can compare the green bar with the red line directly: if the green bar is below the line, YES in that group did not reach the quarter of the electorate that the law required.
The split at 51%
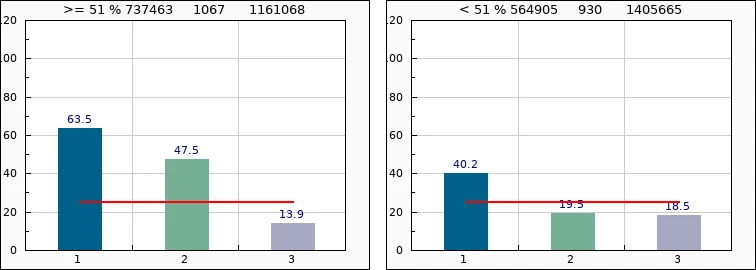
How to read this chart
The page was opened with tk=51. The heading of each panel gives, in order, the turnout limit, the number of participants, the number of polling stations and the number of registered voters in that group.
What it shows
The country divides into two almost equal halves. The 1,067 stations at or above 51% turnout had 45% of the voters; YES there reached 47.5% of voters, almost twice the required quarter. The 930 stations below 51% had 55% of the voters, and there YES was only 19.5% of voters, below the 25% line, with NO close behind at 18.5%.
In the larger half of the electorate, the stations with ordinary turnout, the draft did not reach the quarter of voters that the law required. It passed nationally because of the high-turnout half.
Multiplying the shares by the voters gives the votes behind them: about 551,500 YES votes came from the high-turnout stations and about 274,100 from the rest. Two thirds of all 825,292 YES votes were cast at the stations with 51% turnout or more, which had less than half of the voters.
Moving the limit down: 20%, 30%, 40%
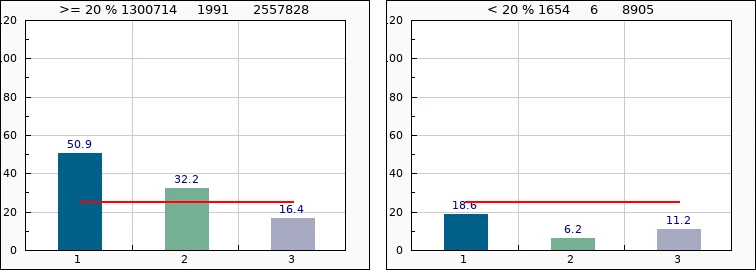
How to read this chart
The page was opened with tk=20. The heading of each panel gives, in order, the turnout limit, the number of participants, the number of polling stations and the number of registered voters in that group.
What it shows
Only 6 small stations had turnout under 20%. There YES was 6.2% of voters and NO 11.2%: NO beat YES. The other 1,991 stations look like the national result: 50.9% turnout, YES 32.2% of voters.
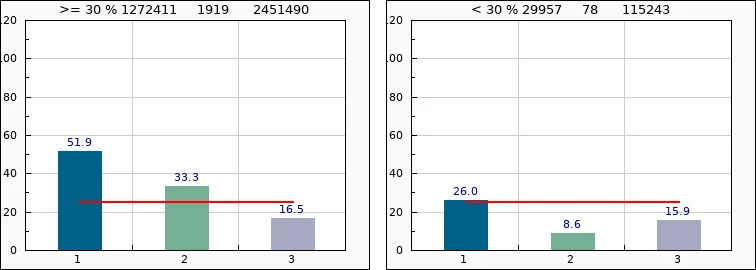
How to read this chart
The page was opened with tk=30. The heading of each panel gives, in order, the turnout limit, the number of participants, the number of polling stations and the number of registered voters in that group.
What it shows
78 stations, with 115,243 voters, were under 30%. Turnout there was 26%, YES 8.6% of voters and NO 15.9%: again NO was almost twice YES.
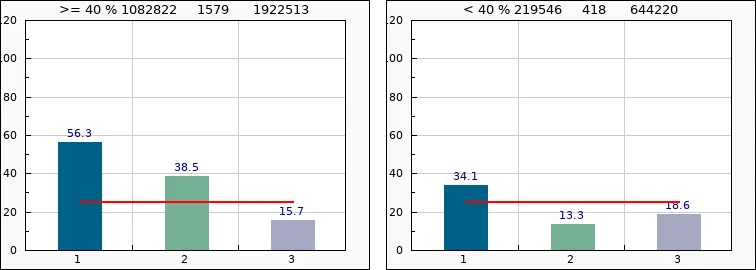
How to read this chart
The page was opened with tk=40. The heading of each panel gives, in order, the turnout limit, the number of participants, the number of polling stations and the number of registered voters in that group.
What it shows
418 stations with 644,220 voters, a quarter of the electorate, had turnout below 40%. Their YES was 13.3% of voters, NO 18.6%. In this quarter of the country, the side that voted NO was larger than the side that voted YES.
Moving the limit up: 70%, 80%, 90%
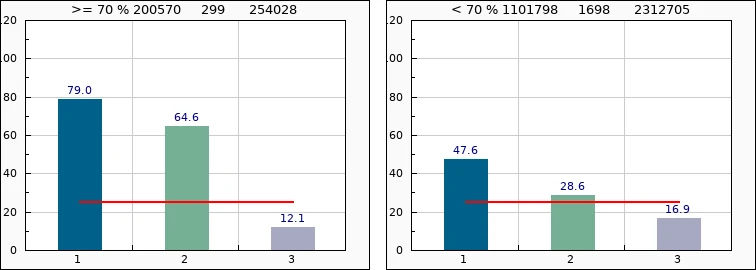
How to read this chart
The page was opened with tk=70. The heading of each panel gives, in order, the turnout limit, the number of participants, the number of polling stations and the number of registered voters in that group.
What it shows
299 stations with 254,028 voters (10% of the electorate) reported 70% turnout or more. YES there was 64.6% of voters, more than two and a half times the required quarter, while NO was 12.1%.
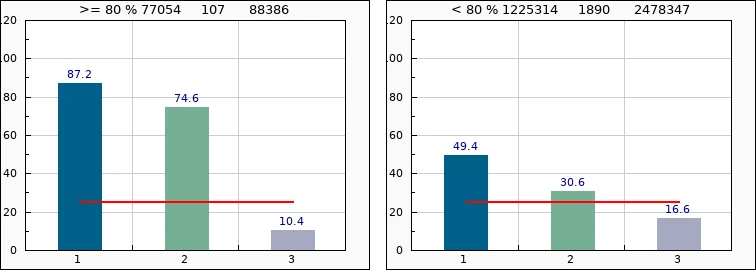
How to read this chart
The page was opened with tk=80. The heading of each panel gives, in order, the turnout limit, the number of participants, the number of polling stations and the number of registered voters in that group.
What it shows
107 stations had 80% turnout or more: average turnout 87.2%, YES 74.6% of voters, NO 10.4%.
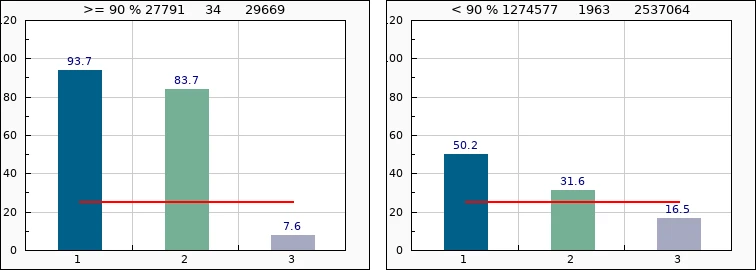
How to read this chart
The page was opened with tk=90. The heading of each panel gives, in order, the turnout limit, the number of participants, the number of polling stations and the number of registered voters in that group.
What it shows
34 stations, with 29,669 voters, reported 90% turnout or more: 93.7% turnout and 83.7% of all registered voters voting YES. NO was 7.6%. For comparison, in December, with many voters abroad for work, the national turnout was 50.74%.
The higher the turnout limit, the higher the YES share and the lower the NO share. Turnout itself does not decide how people vote, so a pattern this steady points to votes added where turnout is high.
All seven splits together
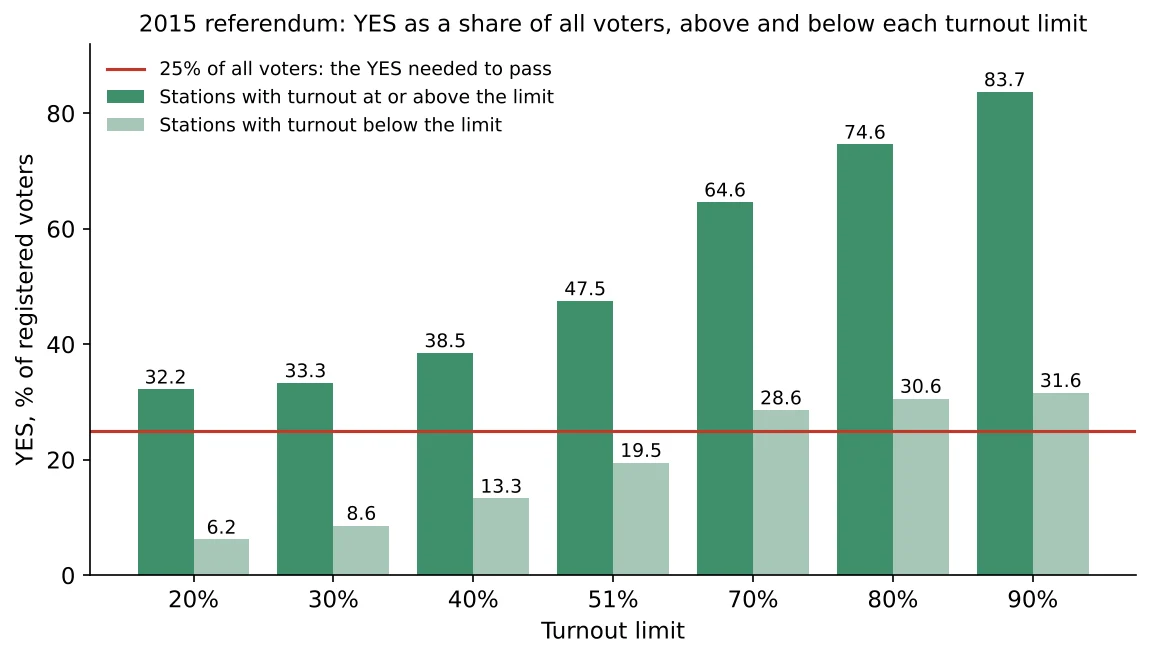
How to read this chart
Each pair of bars is one split. The dark bar is the left panel of the site (stations at or above the limit), the light bar the right panel (stations below it). The red line is the 25% that the YES vote had to reach.
What it shows
- With the limit at 20%, 30%, 40% or 51%, the stations below the limit never reach 25%.
- The YES share above the limit climbs from 32% to 84% as the limit rises.
- Below the limit, YES only passes 25% once the limit is raised to 70% and the “below” group becomes almost the whole country.
Why this matters
In an honest vote, polling stations with high and low turnout can differ, but there is no reason why NO should stay almost flat (16–19% of voters) while YES rises from 6% to 84%. When the NO share is about the same everywhere and only YES grows together with turnout, the extra participants are, in effect, all YES votes. This is the signature of ballots added at the station, the method described in comparing election numbers and in signs of ballot stuffing.
Try it yourself: open the page and change the number after tk= to any turnout, for example 45 or 60.
Data and sources on this site
From the book
This article is based on Chapter VI of Electoral Rights and Election Falsification by Lyudvig Khachatryan, which explains the full method, the formulas and the cases behind it.