Armenia’s 2015 Constitutional Referendum: What the Polling Station Numbers Show
Where turnout was high, YES was high too, and many of those stations reported numbers that do not add up.
Original page on electionscount.info: Votes by polling station depending on turnout, 2015 (charts)The constitutional referendum of December 6, 2015 changed Armenia from a presidential to a parliamentary republic. The electronic monitoring compared its official numbers polling station by polling station. The results below are from that analysis.
Turnout and YES moved together
At polling stations with higher turnout, the share of YES was higher too, and the share of NO fell as turnout grew. That is not how voters normally behave; in a fair vote, high-turnout stations do not all lean the same way.
Every polling station on one chart
The monitoring site has charts that show all 1,997 polling stations at once, sorted by turnout. They make the pattern visible without any calculation.
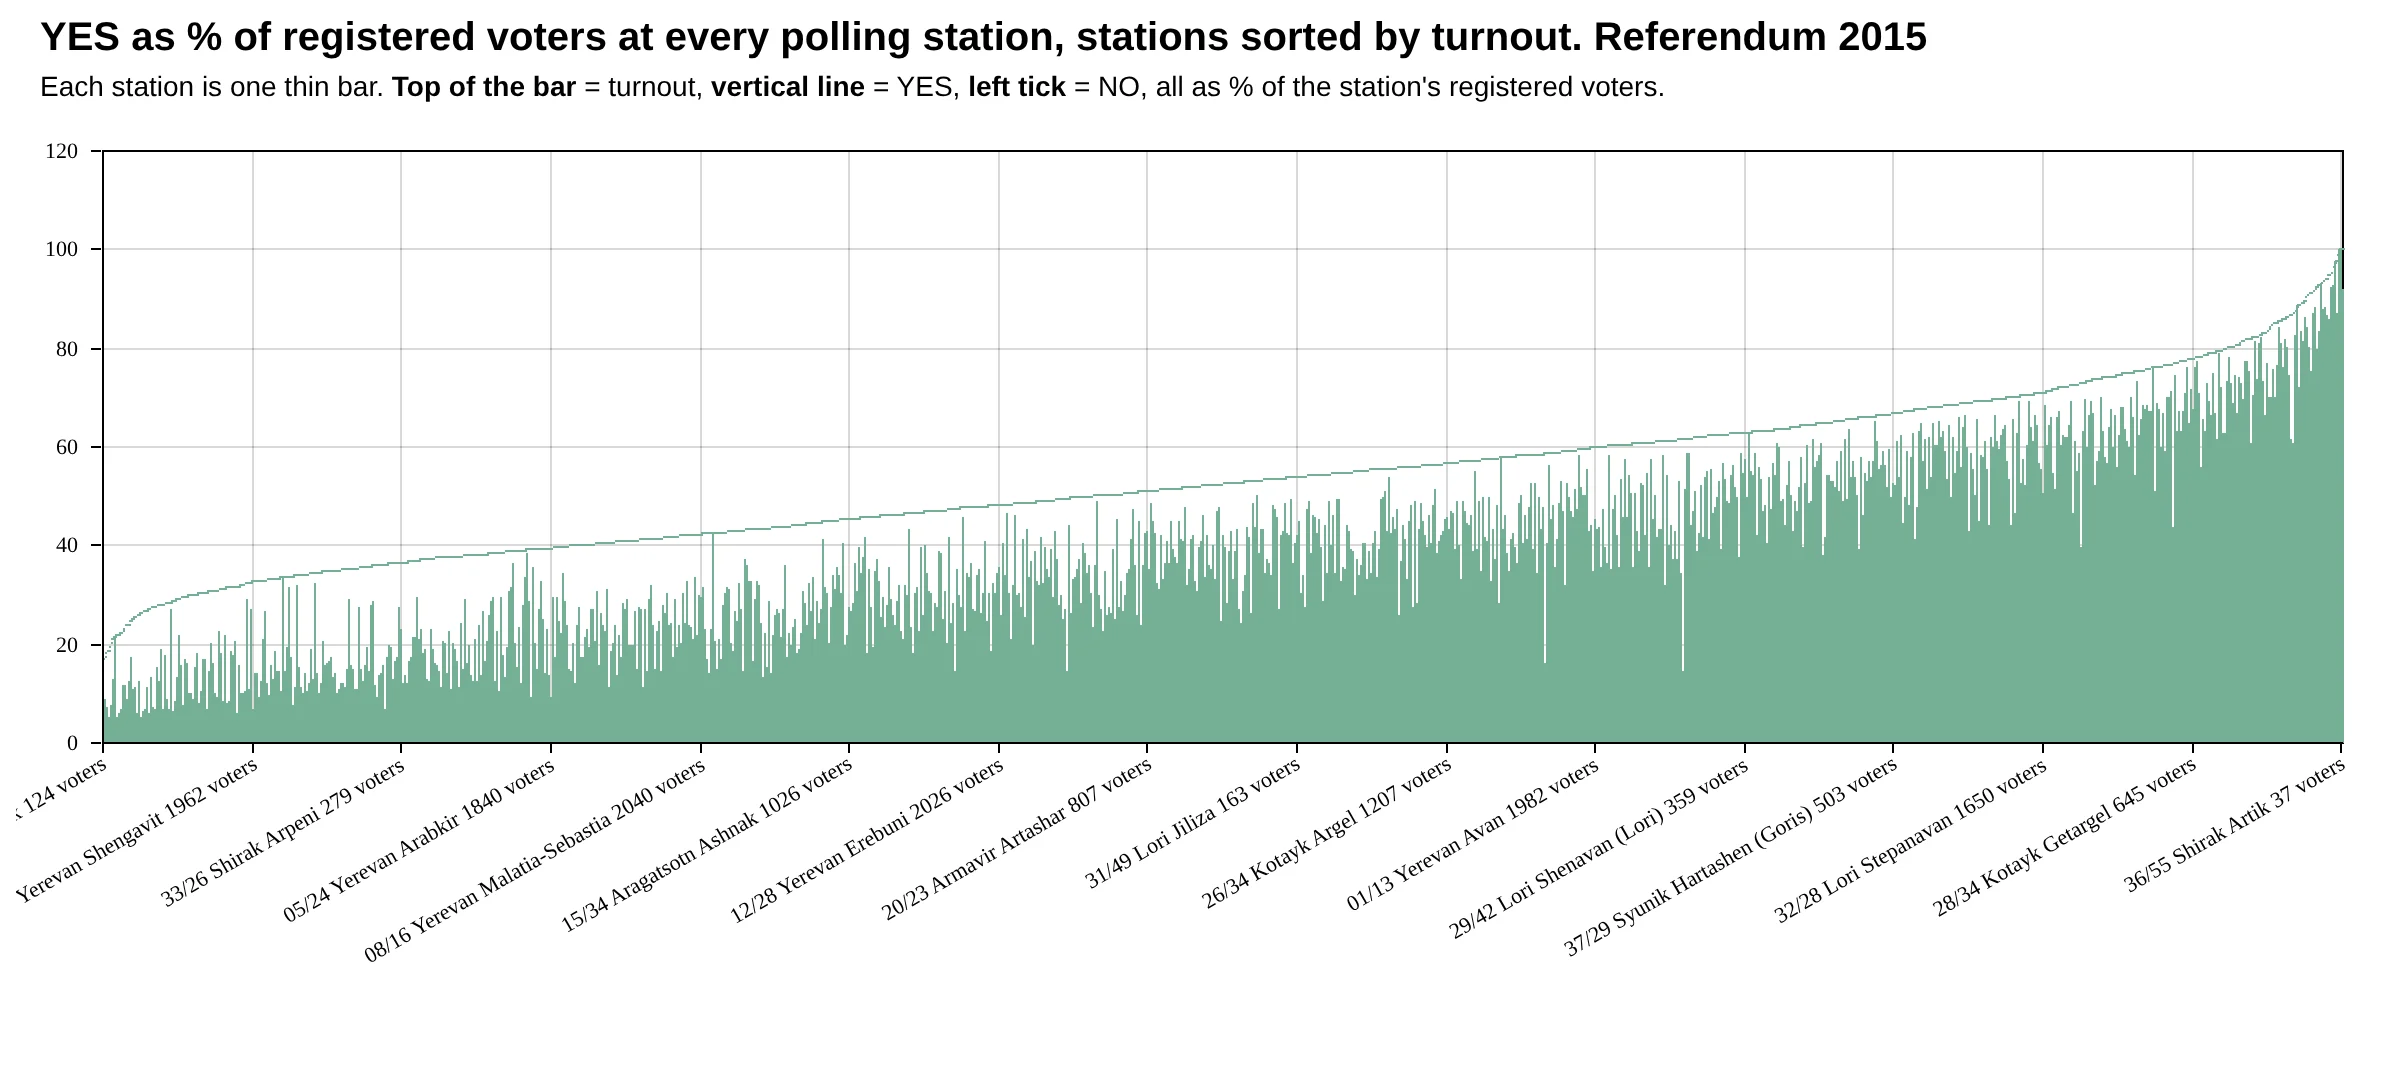
How to read this chart
Each of the 1,997 polling stations is one thin bar, sorted from the lowest turnout on the left to the highest on the right. The top line is turnout and the green bar is YES, both as a share of the station's registered voters.
What it shows
If voters behaved the same everywhere, the green bars would stay a fixed distance below the top line. Instead the gap closes: on the left, YES is less than half of those who voted; on the far right, almost everyone who voted is counted as YES.
- Turnout under 40% (418 stations): YES 39.1% of participants.
- Turnout 50–60% (452 stations): YES 67.8%.
- Turnout 70–80% (192 stations): YES 79.5%.
- Turnout 90% and more (34 stations): YES 89.4%.
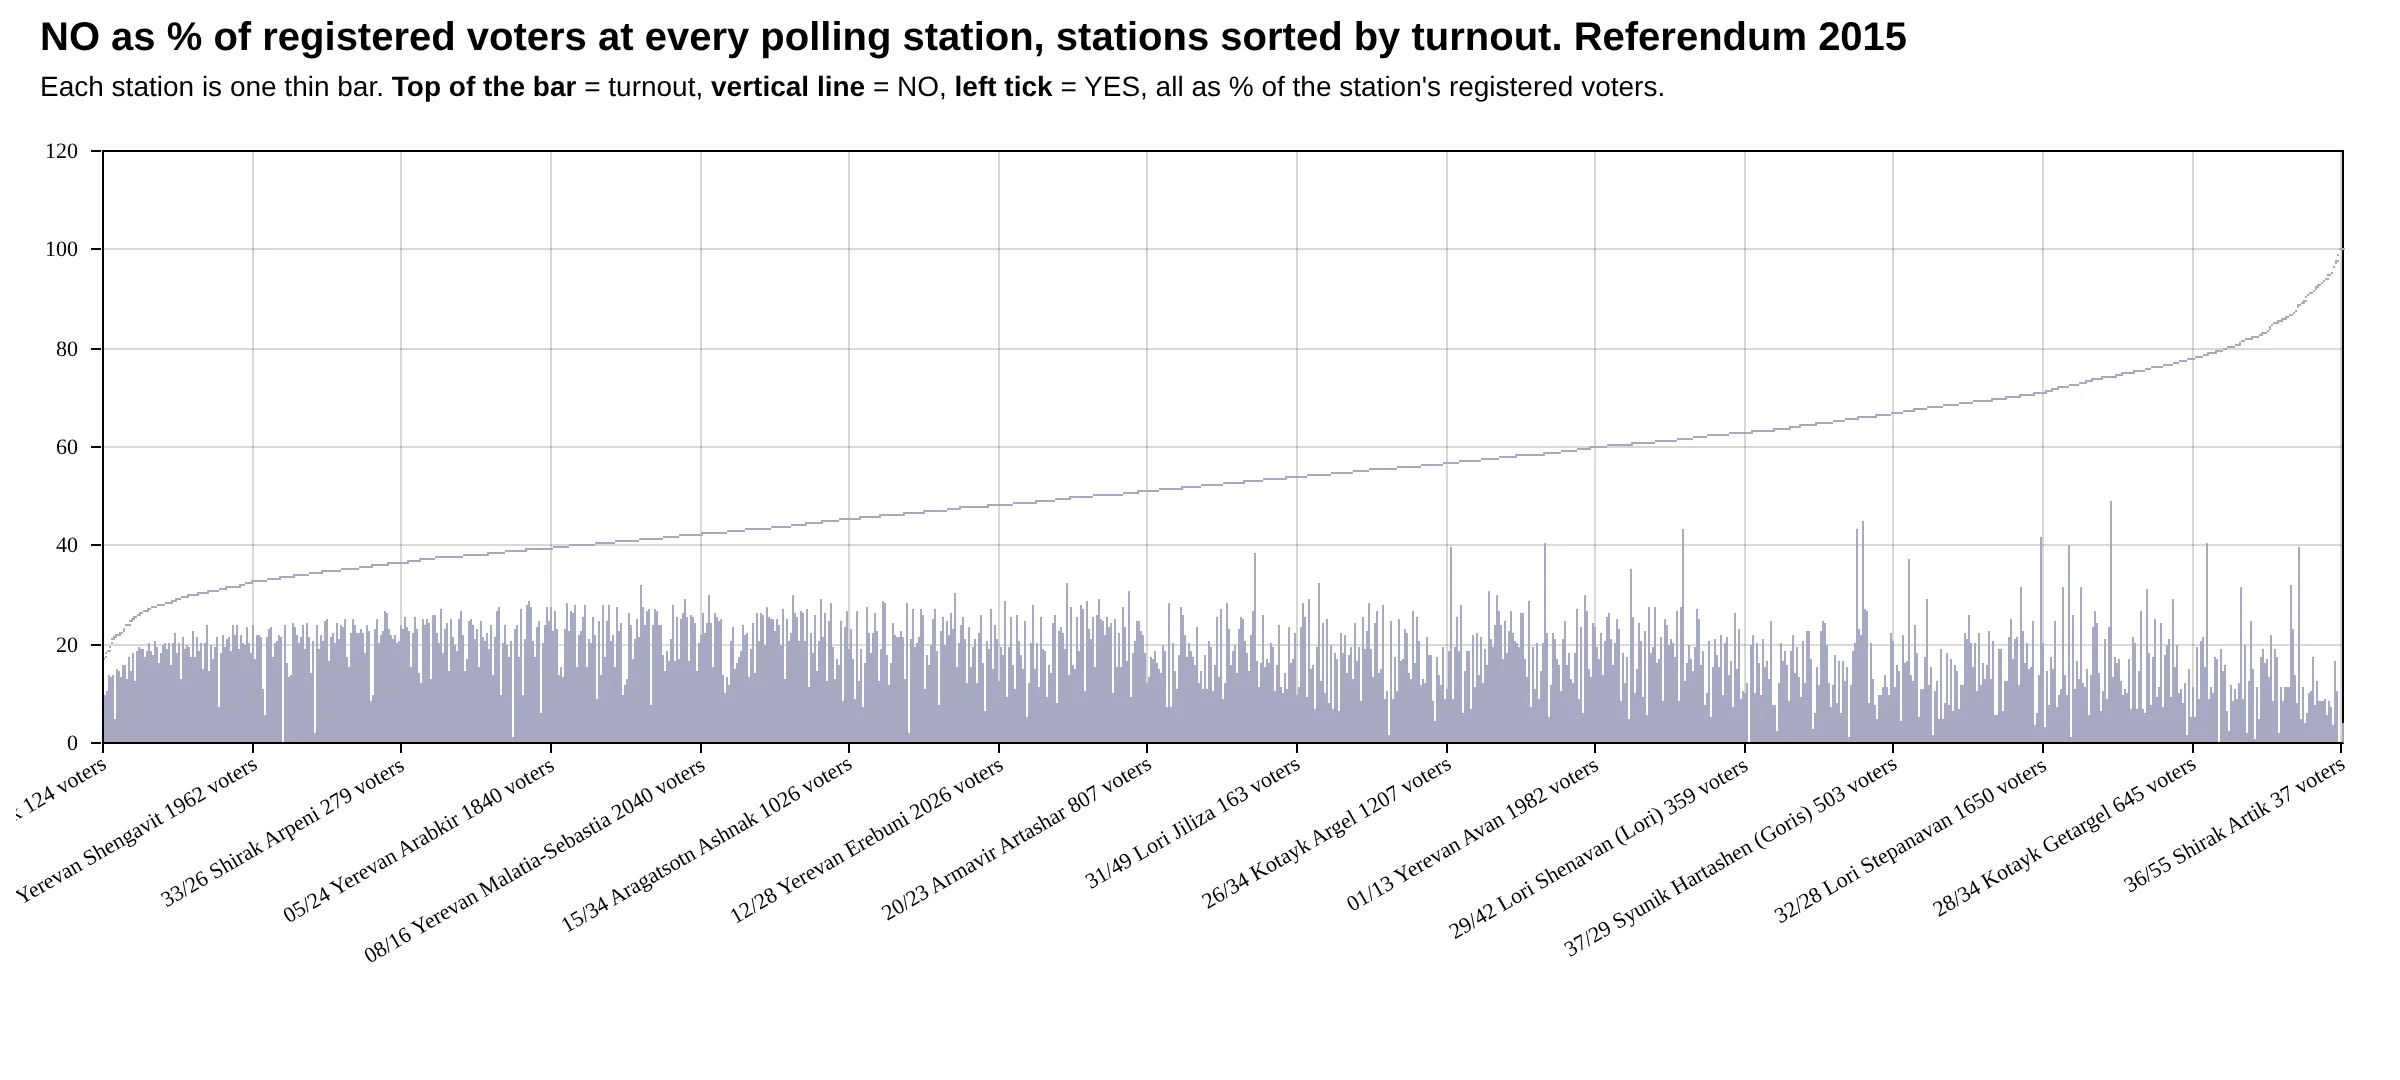
How to read this chart
The same 1,997 stations in the same order. Now the vertical line is NO, as a share of registered voters, and the top line is still turnout.
What it shows
NO is highest at low-turnout stations and almost disappears at the right end. NO took 54.6% of participants where turnout was under 40%, but only 8.1% where it was 90% or more. Extra turnout added YES votes almost exclusively.
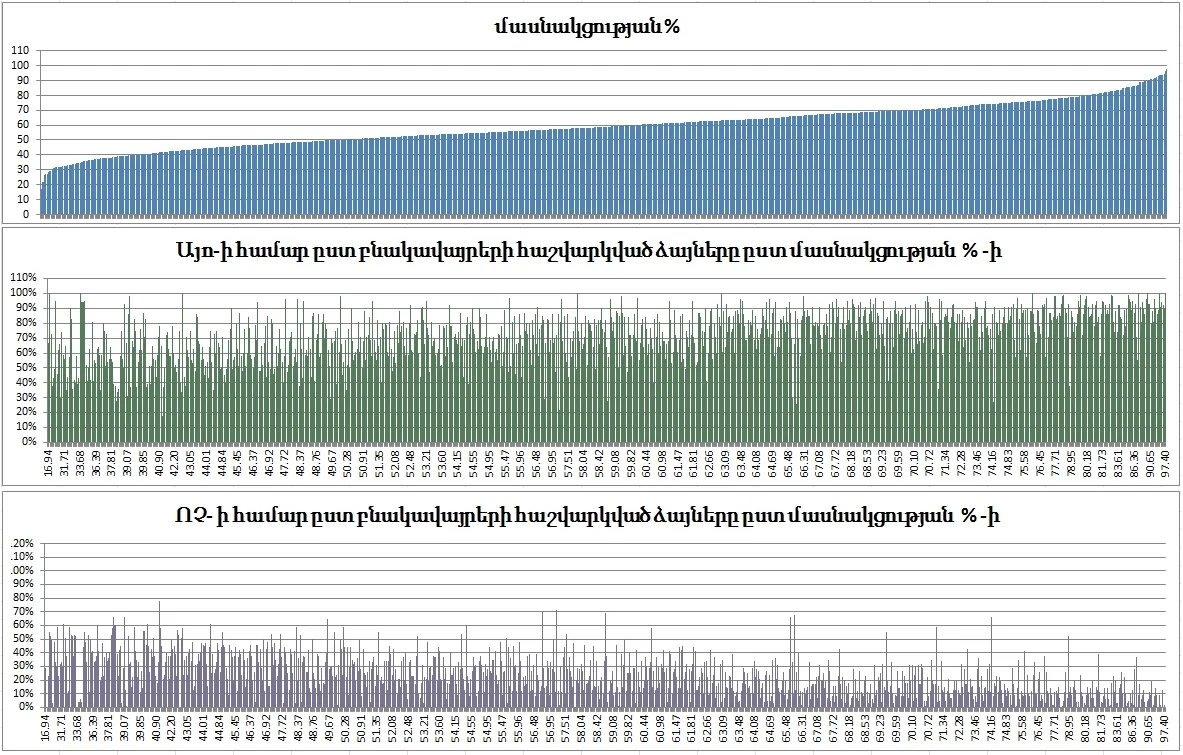
How to read this chart
The same idea by community (village or town) instead of polling station. Top panel: turnout, sorted from 16.94% to 97.40%. Middle panel: YES. Bottom panel: NO. Both are shares of participants in that community.
What it shows
From left to right the middle panel rises from mostly 30–60% to 80–100%, while the bottom panel falls from 40–60% to mostly under 20%. In the communities with the highest turnout, YES is close to 100%.
Key to the Armenian labels: մասնակցության % = turnout %; Այո = YES; Ոչ = NO; ըստ բնակավայրերի = by community.
An average turnout of 70% at those 667 stations is unlikely: it would be higher than the number of voters actually living there, and at some stations perhaps higher than the whole population.
Regions that did not follow the pattern
| Area | Turnout | YES, as a share of all voters |
|---|---|---|
| Yerevan (471 stations, about 33% of all voters) | 46.36% | 24.5% |
| Shirak | 41.27% | 21.47% |
| Lori | 46.24% | 26% |
Against these figures, the extremely high turnout at many stations in Ararat, Gegharkunik, Syunik and Armavir is in itself a reason to doubt their results.
Impossible speed
474 polling stations reported voting at under 60 seconds per voter, with 476,719 participants. About 100 stations reported times below the 44-second minimum needed to register one person. At 5 stations, turnout went down between two official reports. See how capacity is calculated.
Numbers that do not match
Electoral numbers did not match at 614 stations with 931,092 voters and 449,250 participants. At about 250 of them turnout was above 70%, and YES took 82% of participants. Invalid ballots made up 4.1% of all participants, including at stations that raised no other doubts.
Same building, different result
There are 289 polling stations at 140 shared addresses. Stations a few meters apart should give similar results. Yet at 44 addresses, one station reported high turnout, impossible speed and a large YES win, while the other station in the same building reported a modest NO win. The analysis concludes that at no fewer than 49 of these 93 stations there was ballot stuffing and forged signatures.
Oversight made a difference
Where there was proper public oversight, turnout was lower and votes were split differently than at stations without it. Since the voters were the same kind of people, the difference points to what happened at the stations without observers.
Data and sources on this site
From the book
This article is based on Chapters V and VI of Electoral Rights and Election Falsification by Lyudvig Khachatryan, which explains the full method, the formulas and the cases behind it.