2015 Referendum in Armenia by Province: Turnout and YES Votes
In the provinces where more people were reported to vote, a larger share of them voted YES, and those provinces carried the referendum over its legal threshold.
Original page on electionscount.info: Turnout in % by province, 2015 (chart)The monitoring site has two charts of the 2015 referendum by province. Below they are shown in English, each with an explanation of what it shows, followed by the full table of official numbers.
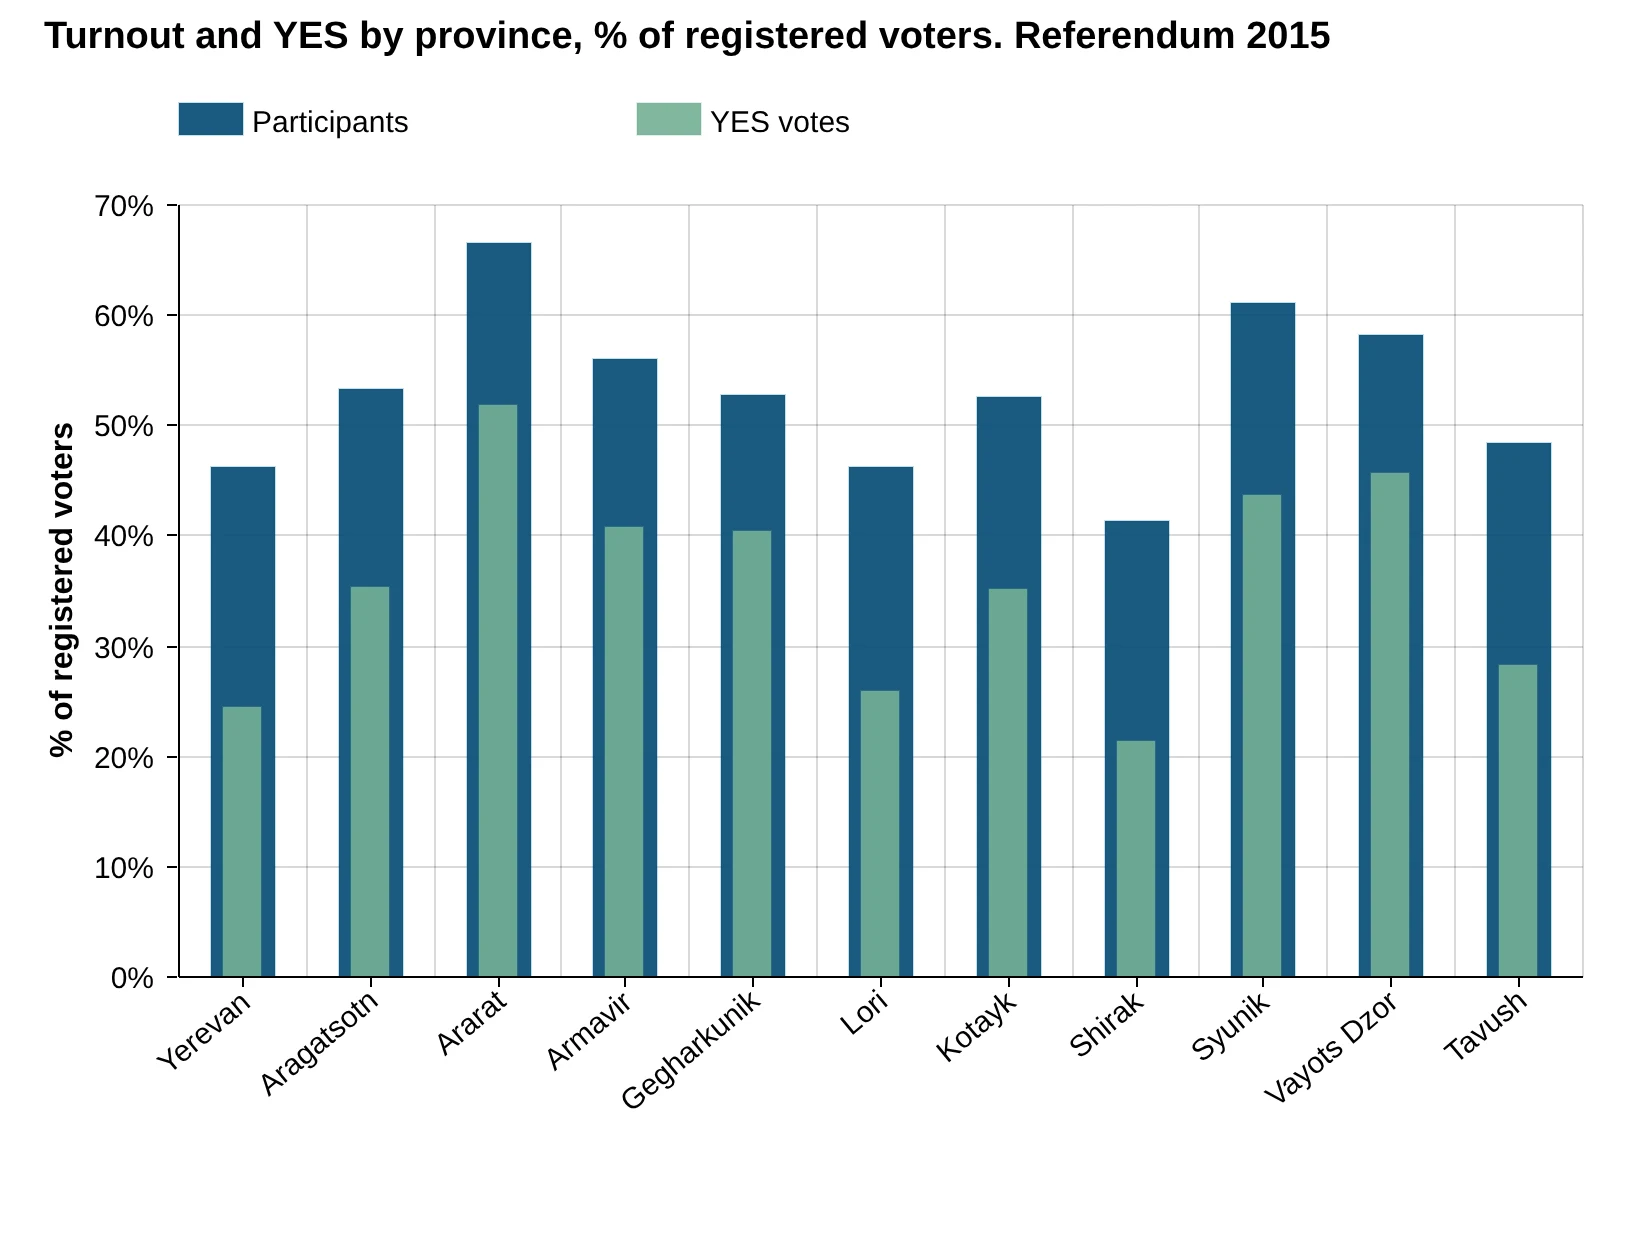
How to read this chart
Each province has two bars, both measured against all registered voters of that province:
- Dark blue: the share who took part (turnout).
- Green: the share who voted YES.
The gap between the two bars is everyone who voted NO or cast an invalid ballot.
What it shows
Where the blue bar is tall, the green bar is tall too, and the gap stays small. In Ararat 66.49% voted and 51.82% of all voters said YES, so nearly 8 in 10 of those who came voted YES. In Shirak only 41.27% voted and 21.47% said YES, about half of those who came.
The green bar passes the 25% line, the legal minimum for YES, clearly only in the high-turnout provinces. Yerevan (24.49%) and Shirak (21.47%) are below it, and Lori (26.01%) only just above.
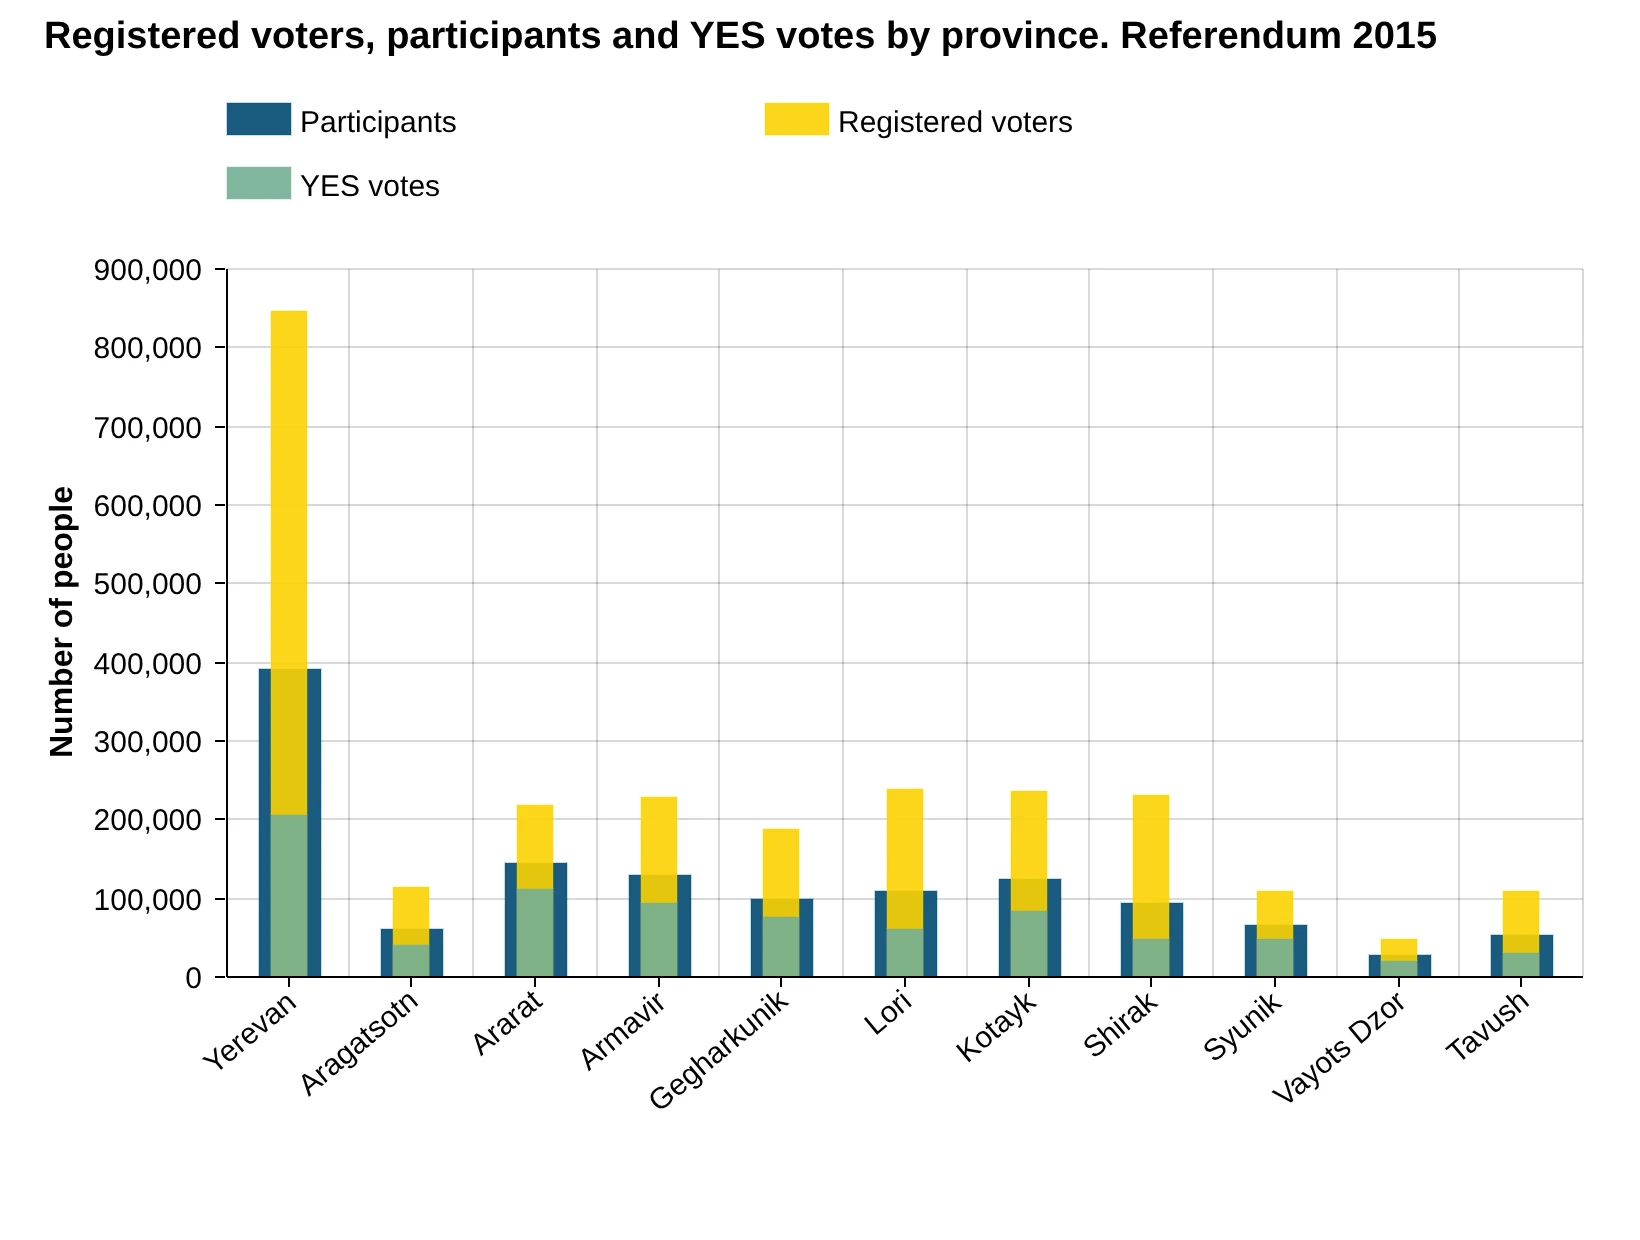
How to read this chart
The same data in people, not percent. Yellow is registered voters, dark blue the participants, green the YES votes.
What it shows
Yerevan dominates: 845,885 voters, a third of the country. Fewer than half of them came (391,735), and 207,182 voted YES.
Ararat has a quarter of Yerevan's voters but gave more than half as many YES votes (112,858). In Ararat, Armavir and Gegharkunik the blue bar reaches more than half of the yellow and the green bar fills most of the blue. In Lori and Shirak, with about as many voters as Armavir, the blue bar is under half the yellow and the green is small.
That is why a few mid-sized provinces with very high turnout weighed as much as the capital.
All the numbers
The table adds one column the charts do not show: YES as a share of the people who actually voted.
| Province | Registered voters | Participants | Turnout | YES votes | YES, % of voters | YES, % of participants |
|---|---|---|---|---|---|---|
| Yerevan | 845,885 | 391,735 | 46.31% | 207,182 | 24.49% | 52.89% |
| Aragatsotn | 115,383 | 61,489 | 53.29% | 40,866 | 35.42% | 66.46% |
| Ararat | 217,788 | 144,798 | 66.49% | 112,858 | 51.82% | 77.94% |
| Armavir | 229,562 | 128,625 | 56.03% | 93,758 | 40.84% | 72.89% |
| Gegharkunik | 187,876 | 99,227 | 52.82% | 75,974 | 40.44% | 76.57% |
| Lori | 238,048 | 110,082 | 46.24% | 61,908 | 26.01% | 56.24% |
| Kotayk | 235,549 | 124,015 | 52.65% | 82,865 | 35.18% | 66.82% |
| Shirak | 230,558 | 95,145 | 41.27% | 49,492 | 21.47% | 52.02% |
| Syunik | 109,448 | 66,918 | 61.14% | 47,926 | 43.79% | 71.62% |
| Vayots Dzor | 47,149 | 27,409 | 58.13% | 21,515 | 45.63% | 78.50% |
| Tavush | 109,487 | 52,925 | 48.34% | 30,948 | 28.27% | 58.48% |
| Armenia | 2,566,733 | 1,302,368 | 50.74% | 825,292 | 32.15% | 63.37% |
The pattern: more turnout, more YES
Sort the provinces by turnout and the YES share follows almost the same order. Shirak had the lowest turnout, 41.27%, and the lowest YES share, 52.02% of participants. Ararat had the highest turnout, 66.49%, and one of the highest YES shares, 77.94%. Across the 11 provinces the correlation between turnout and the YES share of participants is about 0.88, very strong.
In a fair vote there is no reason for this. Extra voters who come out in one province are not all YES voters; people who stay home are not all NO voters. When higher turnout comes almost entirely as YES votes, the extra turnout is the first place to look for added ballots. The polling-station analysis confirms it: the same provinces have the stations with impossible voting speeds and mismatched numbers, described in the polling-station analysis of the referendum.
Why the high-turnout areas mattered
For the new Constitution to pass, YES needed more than half of the participants and at least a quarter of all registered voters. A quarter of 2,566,733 is 641,684 votes. The official total was 825,292, so the second condition looks safely met.
But the monitoring found that at the 1,330 polling stations with turnout up to 60%, YES votes did not exceed about 640,000, just under that quarter. The referendum crossed the threshold thanks to the 667 stations with turnout above 60%, the same stations where turnout was often above what the polling station could physically handle.
Yerevan, Shirak and Lori as a benchmark
Yerevan alone has a third of all voters. Together with Shirak and Lori, the provinces with Armenia's second and third largest cities, Gyumri and Vanadzor, it had turnout of 41–46% and YES at 52–56% of participants. These are also the areas with the most observers and journalists. Together they gave YES 318,582 votes out of 1,314,491 registered voters, 24.2%. If the whole country had voted like them, YES would have stayed below the required quarter of registered voters.
Explore the charts
On the turnout chart, click a province to open the same chart for its communities, and then a community to see its polling stations. The chart in numbers shows the same data as vote counts.
Data and sources on this site
From the book
This article is based on Chapter VI of Electoral Rights and Election Falsification by Lyudvig Khachatryan, which explains the full method, the formulas and the cases behind it.