Armenia 2013 Presidential Election: How the Candidates’ Votes Change with Turnout
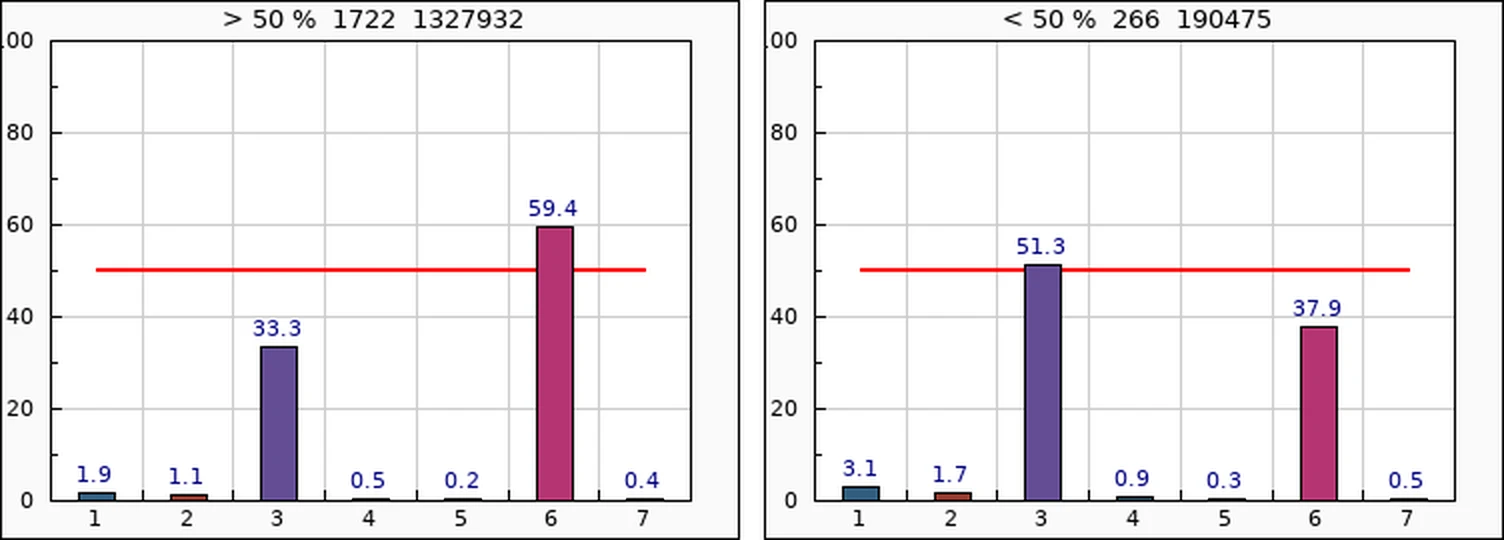
Where turnout was below 50%, Raffi Hovhannisyan won 51%. Where it was above 80%, Serzh Sargsyan won 86%. In the lower-turnout half of the vote Hovhannisyan was ahead.
Original page on electionscount.info: Candidate votes depending on turnout %, 2013 (type any percentage)The 2013 monitoring site has the same tool as 2012: type a turnout percentage and it splits all 1,988 polling stations of the presidential election of 18 February 2013 into two groups, above and below it, and shows each candidate's share in both. The two main candidates were the incumbent, Serzh Sargsyan (6), and Raffi Hovhannisyan (3).
How to read this chart
Bars are the 7 candidates, numbered as on the ballot. Left: the 1,722 polling stations with turnout above 50% (1,327,932 participants). Right: the 266 stations below 50% (190,475 participants). Each bar is the candidate's votes as a share of all participants. The red line is 50%, the share needed to win in the first round.
What it shows
Below 50% turnout Hovhannisyan had 51.3% of participants and Sargsyan 37.9%. Above 50%, Sargsyan had 59.4% and Hovhannisyan 33.3%.
Candidate numbers: 1 Hrant Bagratyan; 2 Paruyr Hayrikyan; 3 Raffi K. Hovhannisyan; 4 Andrias Ghukasyan; 5 Arman Melikyan; 6 Serzh Sargsyan; 7 Vardan Sedrakyan.
How to read this chart
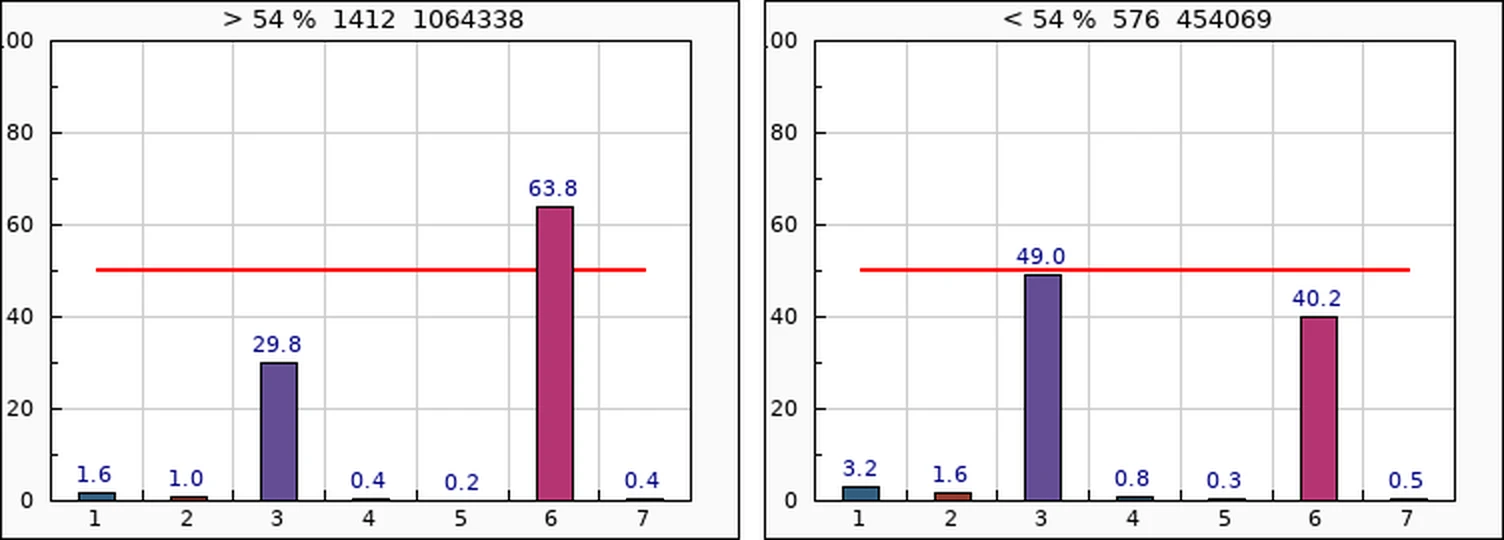
Bars are the 7 candidates, numbered as on the ballot. Left: the 1,412 polling stations with turnout above 54% (1,064,338 participants). Right: the 576 stations below 54% (454,069 participants). Each bar is the candidate's votes as a share of all participants. The red line is 50%, the share needed to win in the first round.
What it shows
At 54%, the site's default, Sargsyan had 63.8% above and 40.2% below; Hovhannisyan 29.8% above and 49.0% below.
Candidate numbers: 1 Hrant Bagratyan; 2 Paruyr Hayrikyan; 3 Raffi K. Hovhannisyan; 4 Andrias Ghukasyan; 5 Arman Melikyan; 6 Serzh Sargsyan; 7 Vardan Sedrakyan.
How to read this chart
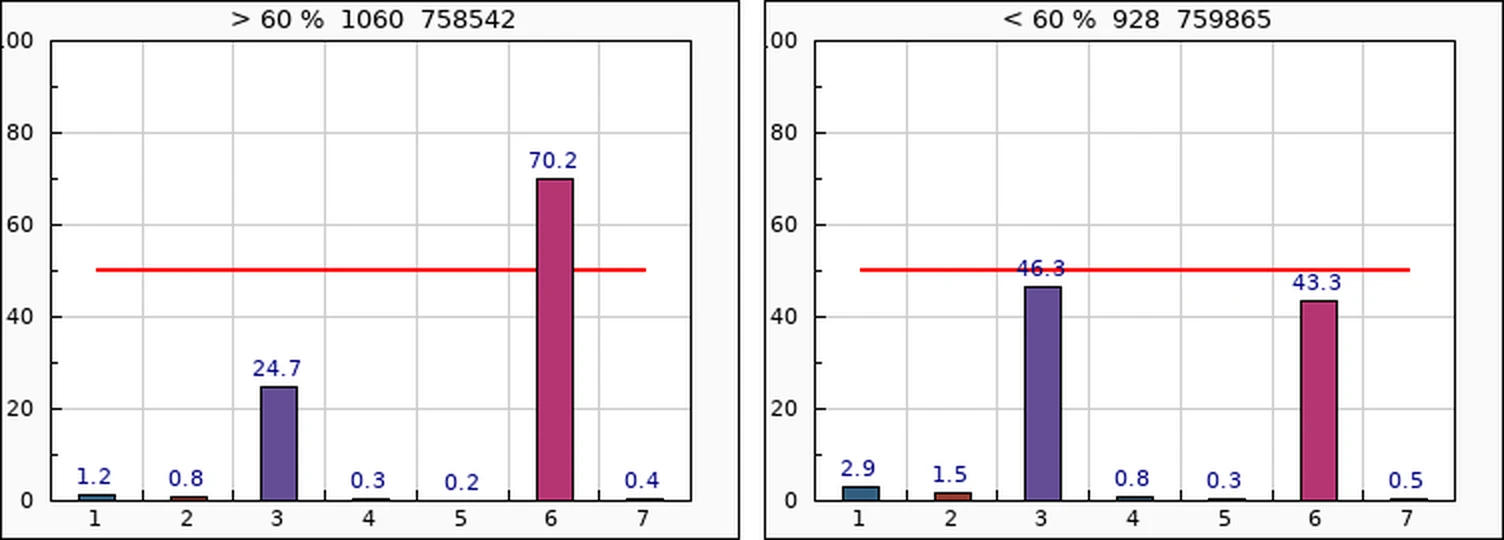
Bars are the 7 candidates, numbered as on the ballot. Left: the 1,060 polling stations with turnout above 60% (758,542 participants). Right: the 928 stations below 60% (759,865 participants). Each bar is the candidate's votes as a share of all participants. The red line is 50%, the share needed to win in the first round.
What it shows
At 60% the two groups are almost exactly equal in size: about 759,000 participants each. In the lower-turnout half, Hovhannisyan led, 46.3% to 43.3%. In the higher-turnout half, Sargsyan had 70.2% and Hovhannisyan 24.7%.
Candidate numbers: 1 Hrant Bagratyan; 2 Paruyr Hayrikyan; 3 Raffi K. Hovhannisyan; 4 Andrias Ghukasyan; 5 Arman Melikyan; 6 Serzh Sargsyan; 7 Vardan Sedrakyan.
How to read this chart
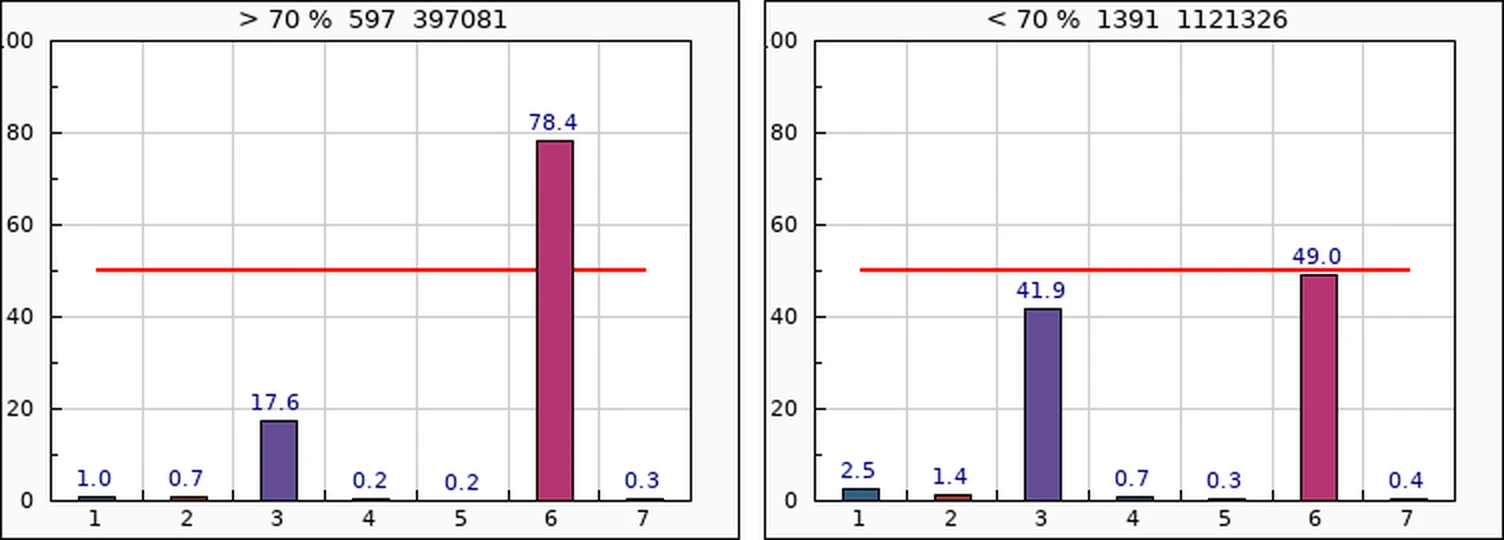
Bars are the 7 candidates, numbered as on the ballot. Left: the 597 polling stations with turnout above 70% (397,081 participants). Right: the 1,391 stations below 70% (1,121,326 participants). Each bar is the candidate's votes as a share of all participants. The red line is 50%, the share needed to win in the first round.
What it shows
Above 70% turnout Sargsyan had 78.4%, Hovhannisyan 17.6%. Below 70% Sargsyan had 49.0%, under the 50% line.
Candidate numbers: 1 Hrant Bagratyan; 2 Paruyr Hayrikyan; 3 Raffi K. Hovhannisyan; 4 Andrias Ghukasyan; 5 Arman Melikyan; 6 Serzh Sargsyan; 7 Vardan Sedrakyan.
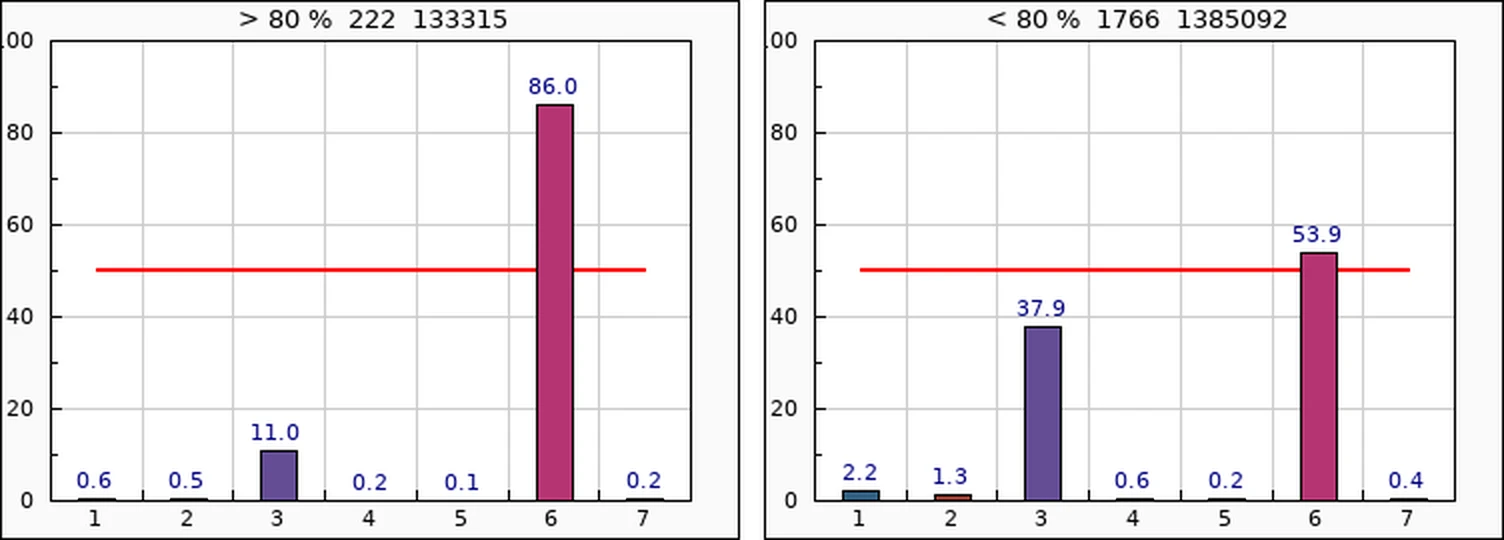
How to read this chart
Bars are the 7 candidates, numbered as on the ballot. Left: the 222 polling stations with turnout above 80% (133,315 participants). Right: the 1,766 stations below 80% (1,385,092 participants). Each bar is the candidate's votes as a share of all participants. The red line is 50%, the share needed to win in the first round.
What it shows
At the 222 stations above 80% turnout, Sargsyan had 86.0% and Hovhannisyan 11.0%.
Candidate numbers: 1 Hrant Bagratyan; 2 Paruyr Hayrikyan; 3 Raffi K. Hovhannisyan; 4 Andrias Ghukasyan; 5 Arman Melikyan; 6 Serzh Sargsyan; 7 Vardan Sedrakyan.
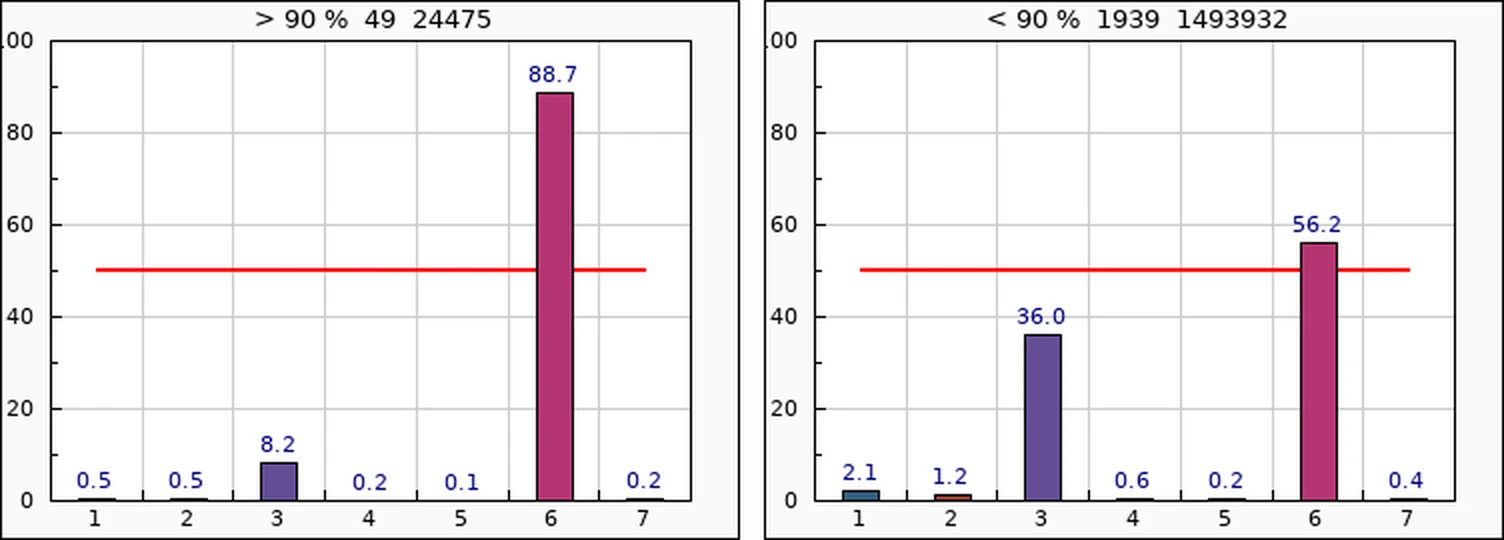
How to read this chart
Bars are the 7 candidates, numbered as on the ballot. Left: the 49 polling stations with turnout above 90% (24,475 participants). Right: the 1,939 stations below 90% (1,493,932 participants). Each bar is the candidate's votes as a share of all participants. The red line is 50%, the share needed to win in the first round.
What it shows
At the 49 stations above 90% turnout, Sargsyan had 88.7% and Hovhannisyan 8.2%; all five other candidates together had about 1.5%.
Candidate numbers: 1 Hrant Bagratyan; 2 Paruyr Hayrikyan; 3 Raffi K. Hovhannisyan; 4 Andrias Ghukasyan; 5 Arman Melikyan; 6 Serzh Sargsyan; 7 Vardan Sedrakyan.
The two main candidates by turnout
| Stations with turnout | Stations | Participants | Sargsyan | Hovhannisyan |
|---|---|---|---|---|
| below 40% | 36 | 16,345 | 30.9% | 59.3% |
| below 50% | 266 | 190,475 | 37.9% | 51.3% |
| below 54% | 576 | 454,069 | 40.2% | 49.0% |
| below 60% | 928 | 759,865 | 43.3% | 46.3% |
| above 60% | 1,060 | 758,542 | 70.2% | 24.7% |
| above 70% | 597 | 397,081 | 78.4% | 17.6% |
| above 80% | 222 | 133,315 | 86.0% | 11.0% |
| above 90% | 49 | 24,475 | 88.7% | 8.2% |
What the split shows
The pattern is the same as in the 2012 parliamentary elections, only stronger. As turnout rises from under 40% to over 90%, the incumbent's share climbs from 31% to 89% and his main rival's falls from 59% to 8%. The other five candidates also lose ground at high-turnout stations.
Real extra voters do not all vote for one candidate. When almost all the additional turnout goes to one side, the method reads it as added ballots and signatures, which is why the monitoring compares these stations' turnout with their physical capacity and their other election numbers. See polling station capacity and the method of comparing election numbers.
The official result was Serzh Sargsyan 58.64% and Raffi Hovhannisyan 36.75%, with turnout of 60.5% (1,518,407 participants). The charts count each candidate's votes as a share of all participants, including invalid ballots, so they are a little lower than the official shares of valid votes.
Try it yourself: open the chart page, type any percentage and press View.
Data and sources on this site
From the book
This article is based on Chapter VI of Electoral Rights and Election Falsification by Lyudvig Khachatryan, which explains the full method, the formulas and the cases behind it.