Armenia 2018: How Fast Polling Stations Voted, Compared with 2017 and 2021
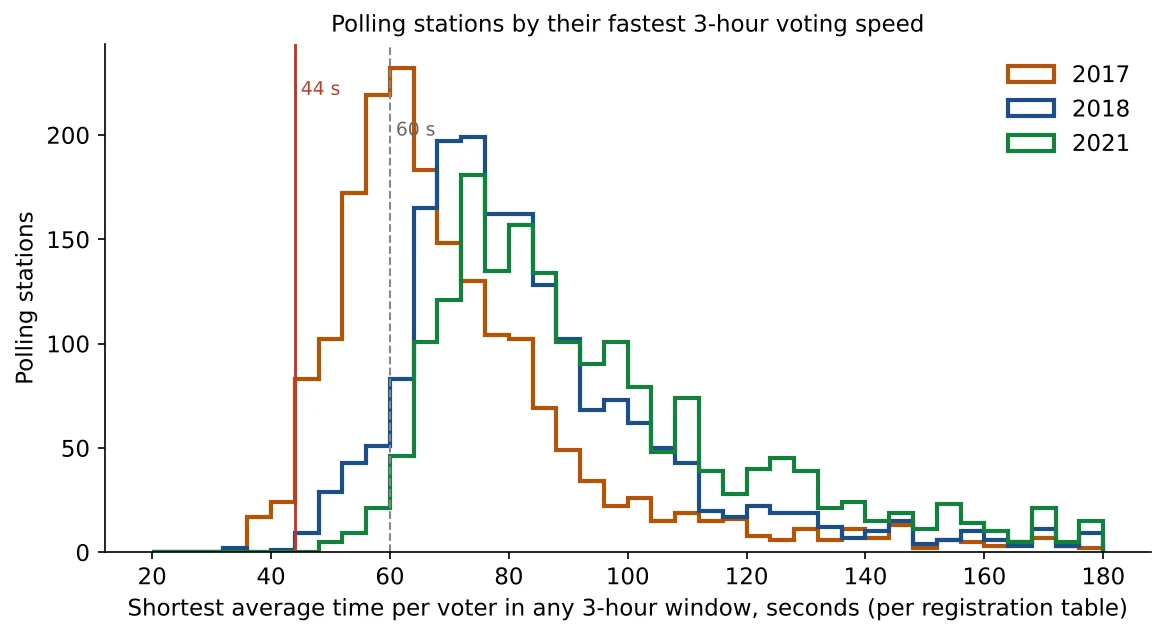
In 2017 the typical polling station reached 67.5 seconds per voter at its busiest; in 2018, 81.2; in 2021, 91.5.
Original page on electionscount.info: Voting speed according to the number of participants announced every 3 hours, 2018Armenia held early parliamentary elections on 9 December 2018, half a year after the change of power. Eleven lists stood. Nikol Pashinyan’s My Step alliance won about 70% of the vote; Prosperous Armenia and Bright Armenia also passed the threshold (5% for parties, 7% for alliances). Turnout was 48.6%.
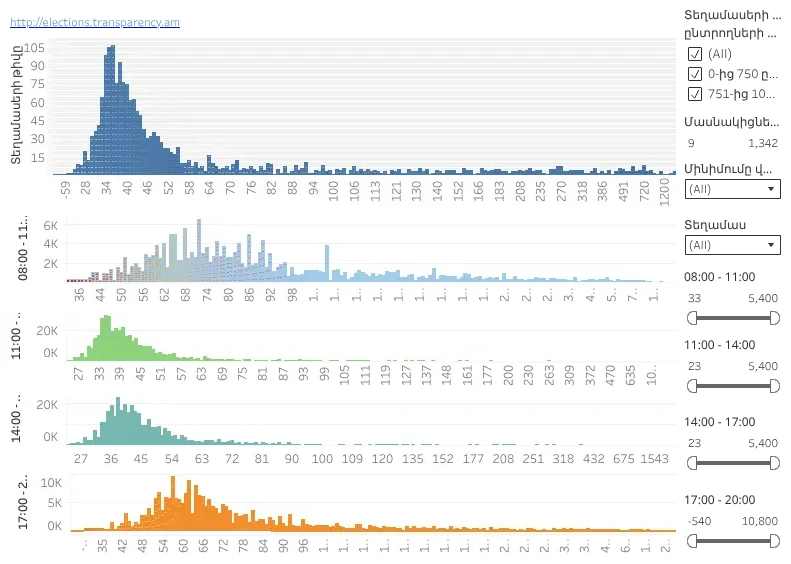
The page “Voting speed according to the number of participants announced every 3 hours” (in English: “how often one envelope is dropped into the ballot box, in seconds”) shows the speed of every polling station as an interactive Tableau chart. It opens with Article 58 of the Electoral Code: voting booths are provided at the rate of at least one per 750 voters.
How to read this chart
- Top: number of polling stations (vertical) by speed, seconds per envelope dropped into the box (horizontal), for the station’s fastest window.
- Four lower charts: 8:00–11:00, 11:00–14:00, 14:00–17:00, 17:00–20:00: the number of participants voting at each speed.
- Right side: filters: station size (0–750 voters, 751–1,000…, following the booth rule), the range of participants (9 to 1,342), the minimum speed, a single station, and a slider for each window.
What it shows
The tallest bars of the top chart are at about 34–40 seconds per envelope. This is the speed of the whole station, not of one table: at a station with two registration tables, 36 seconds per envelope means 72 seconds per voter at each table.
A note on the page: on the Armenian page the Tableau embedding code has been inserted as text, so instead of the chart the page shows a line of code; the English page shows only the static image. The live chart can be opened on Tableau Public.
Per registration table, compared with 2017 and 2021
How to read this chart
Each curve counts polling stations by the shortest average time per voter they reached in any 3-hour window, after dividing by the number of registration tables (two at stations with more than 1,000 voters). The red line is 44 seconds, the grey dashed line 60.
What it shows
- 2017: median 67.5 seconds; 168 stations under 50 seconds and 42 under 44.
- 2018: median 81.2 seconds; 23 under 50 and 3 under 44.
- 2021: median 91.5 seconds; 2 under 50 and none under 44.
From 2017 to 2021 the whole distribution moved to the right: stations reported fewer voters per hour than before. The physical procedure did not change; what changed was how many participants were reported.
The page in numbers is in 150 stations at 60 seconds; the method is in polling station capacity.
Data and sources on this site
From the book
This article is based on Chapter VI of Electoral Rights and Election Falsification by Lyudvig Khachatryan, which explains the full method, the formulas and the cases behind it.