2017, 2018 and 2021 Compared: When Armenians Voted and How Fast
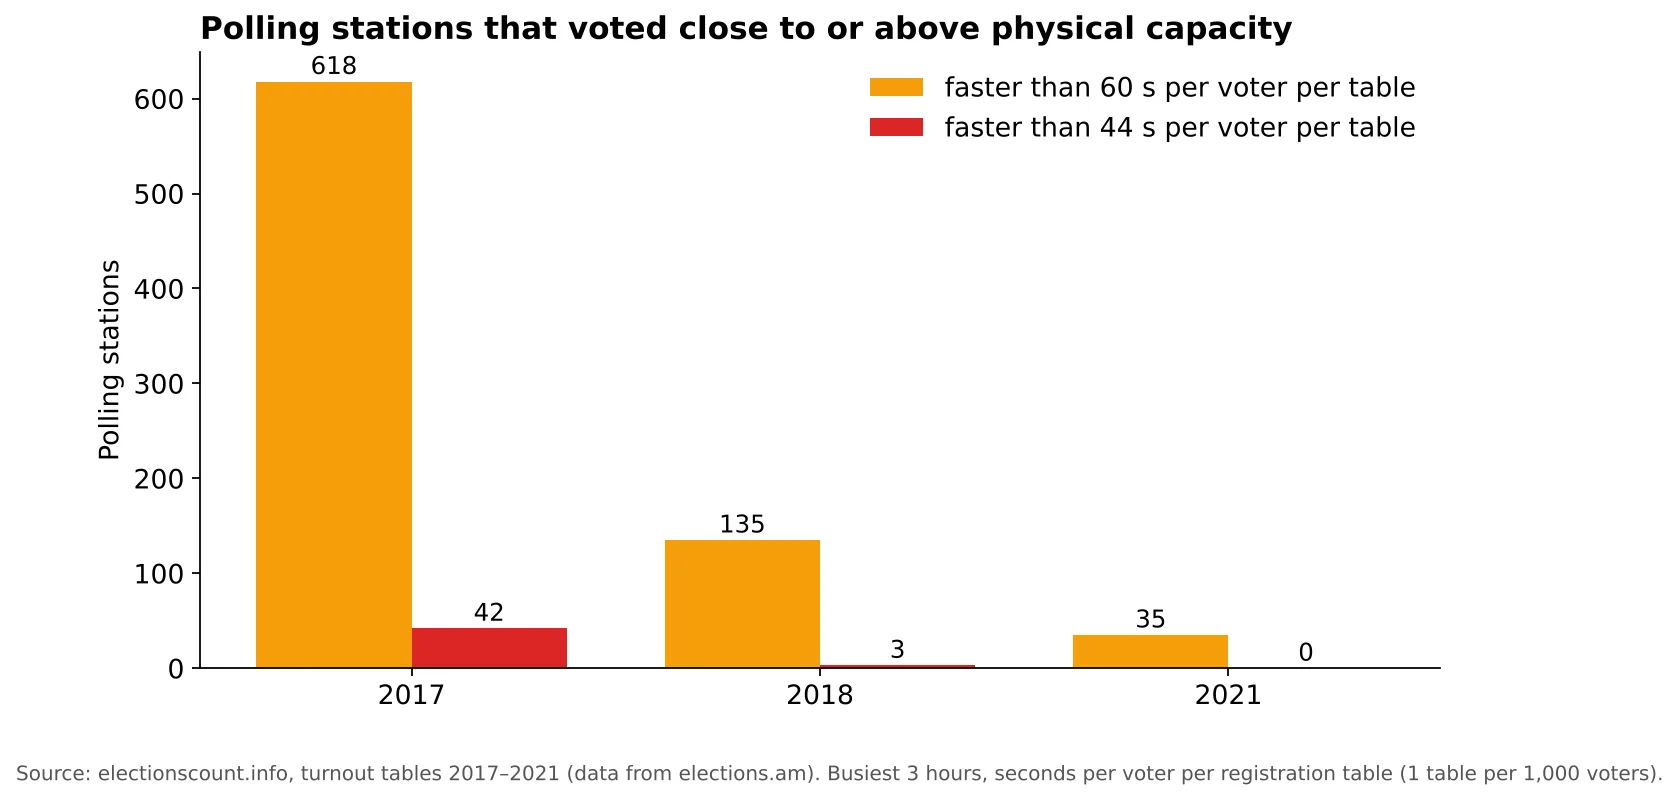
From 2017 to 2021 the number of polling stations voting faster than physically possible fell from 42 to 3 to none.
Original page on electionscount.info: Turnout and voting speed at polling stations, 2017, 2018, 2021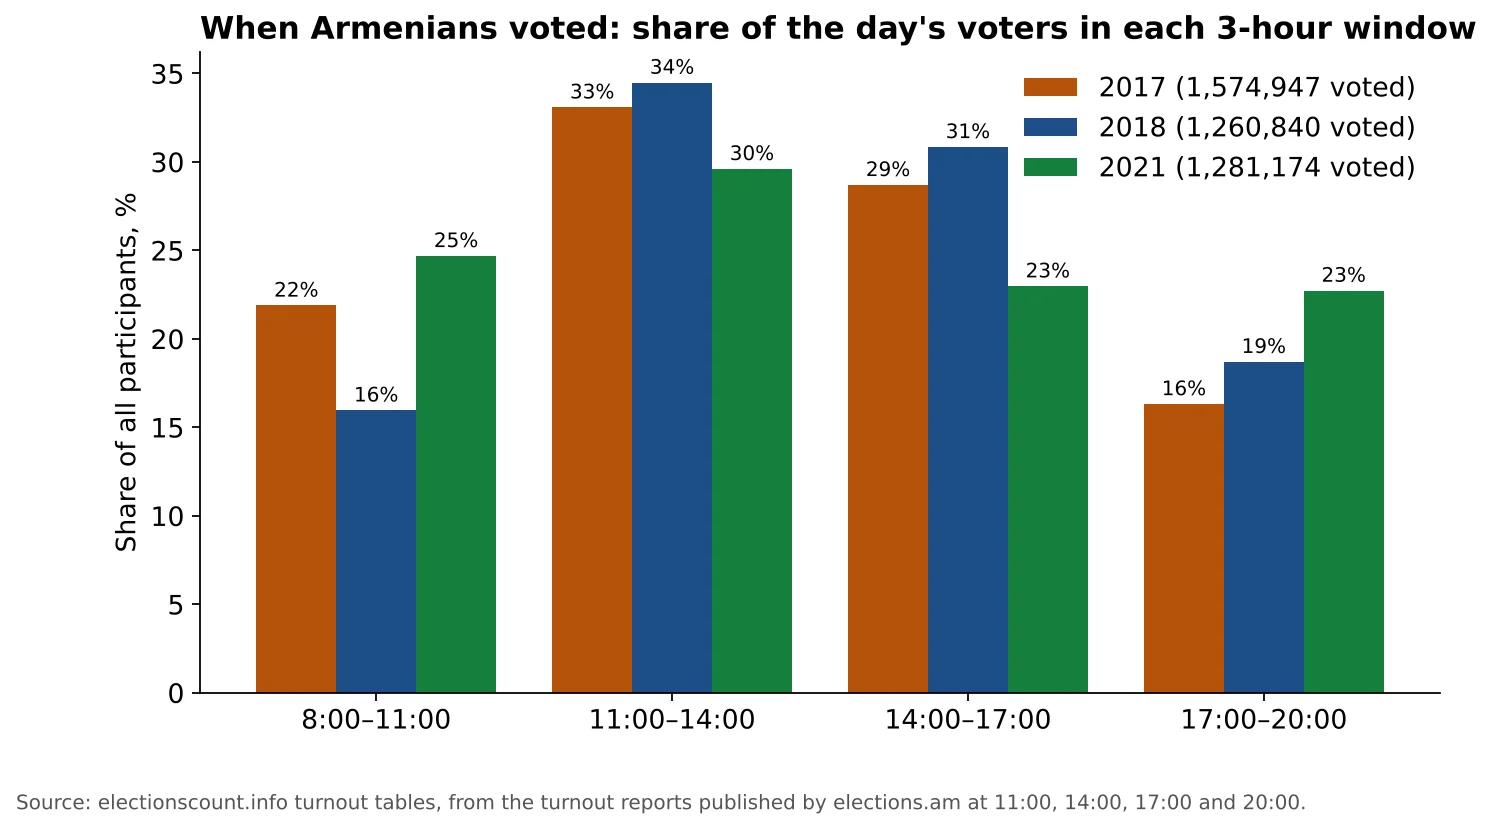
How to read this chart
For each election, the four bars add up to 100% of the people who voted that day. The windows are the periods between the official turnout reports.
What it shows
In 2017 and 2018 the day peaked at midday: a third of all voters came between 11:00 and 14:00. In 2021 the day was flatter: 25%, 30%, 23% and 23%. In 2018, a December election, the morning was the quietest of all, 16%.
How to read this chart
Orange: stations whose busiest 3 hours were faster than 60 seconds per voter per registration table, close to the limit. Red: faster than 44 seconds, above the physical limit.
What it shows
2017: 1,529 stations under 60 s, 42 above capacity. 2018: 1,420 under 60 s, but only 3 above capacity. 2021: 1,254 under 60 s and none above capacity.
What changed
| 2017 | 2018 | 2021 | |
|---|---|---|---|
| Polling stations | 2,009 | 2,010 | 2,008 |
| Registered voters | 2,587,707 | 2,592,479 | 2,593,572 |
| Participants | 1,574,947 | 1,260,840 | 1,281,174 |
| Turnout | 60.86% | 48.63% | 49.40% |
| Stations with turnout of 75% or more (100+ voters) | 192 | 16 | 18 |
| Stations above physical capacity | 42 | 3 | 0 |
| Counts that went down | 2 | 4 | 3 |
Turnout dropped by 314,000 people between 2017 and 2018 while the voter lists barely changed. Most of the drop came from the stations that had reported very high turnout in 2017: the number of stations at 75% or more fell from 192 to 16. That is consistent with the method's reading that a part of the 2017 turnout at those stations was not real.
The capacity rule used here. Registering one voter at one table, checking the ID and handing out the ballot and envelope takes at least about 44 seconds. The Electoral Code (Article 64) gives each polling station at least one registration member per 1,000 voters, so a station with up to 1,000 voters is counted as having one table, up to 2,000 voters two tables. The "seconds per voter per table" figure is the station's fastest 3-hour average multiplied by its number of tables. Below 44 seconds, the reported turnout is faster than the station could physically register people.
Data and sources on this site
From the book
This article is based on Chapter VI of Electoral Rights and Election Falsification by Lyudvig Khachatryan, which explains the full method, the formulas and the cases behind it.