Armenia 2012–2018: Polling Stations With Impossibly Fast Voting, Election by Election
Polling stations reporting voters faster than 44 seconds per registration table: 42 in 2017, 3 in 2018, none in 2021.
Original page on electionscount.info: Polling stations with very fast voting, 2012–2018The page “Polling stations with very fast voting, 2012–2018” puts five elections side by side: the 2012 parliamentary and 2013 presidential elections, the 2015 referendum, and the 2017 and 2018 parliamentary elections. For each, it counts the polling stations whose average time per voter in their busiest three hours was below 50 seconds.
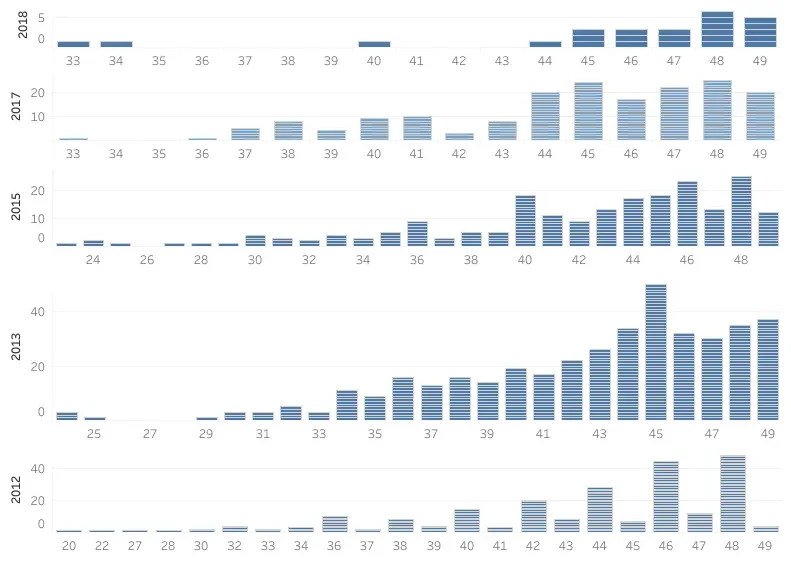
How to read this chart
One row per election, newest at the top. The horizontal axis is the average time per voter in seconds, from about 20 to 49; the bars count the stations at that speed. Each bar is built from thin stripes, one per station; on Tableau Public, pointing at a stripe shows the station. The vertical scales differ between rows.
What it shows
- 2013 has the most fast stations, with up to about 50 at 45 seconds and many in the 30s.
- 2012 peaks at about 45–50 stations at 46 and 48 seconds.
- 2015 and 2017 have 10–25 stations at each second from 40 to 49.
- 2018 has only a handful, mostly at 44–49 seconds.
The number of polling stations that reported impossibly fast voting fell sharply after 2017. The procedure for registering a voter stayed the same, so the change is in the reported numbers.
A note on the page: as on the other Tableau pages of the 2018 section, the embedding code is printed as text, so the chart is visible only on Tableau Public.
With 2021 added
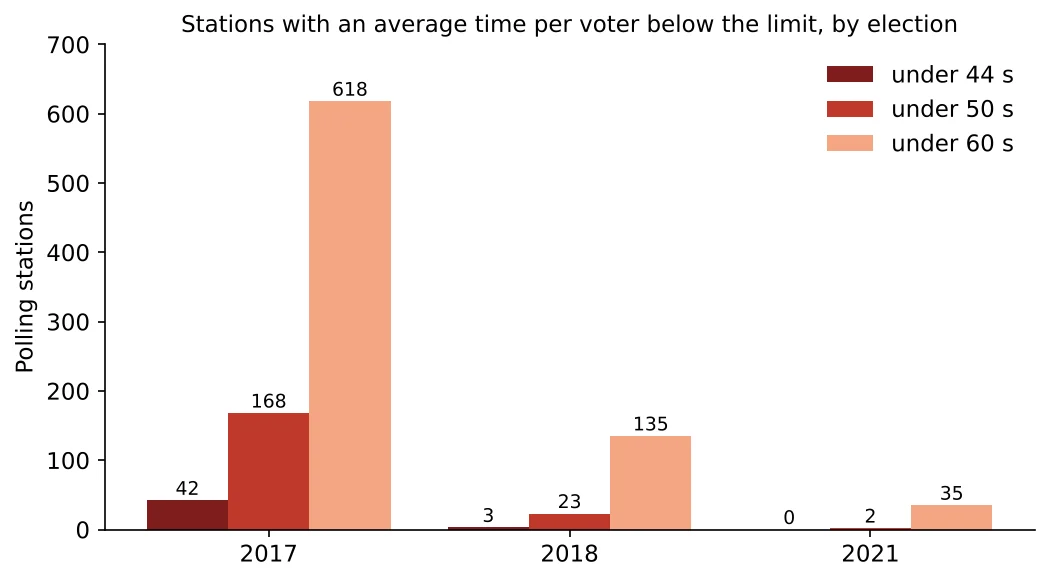
How to read this chart
For 2017, 2018 and 2021, where the site has the turnout of every station in every window, each group of bars counts the stations whose fastest 3-hour average, per registration table, was below 44, 50 and 60 seconds.
What it shows
- 2017: 42 under 44 s, 168 under 50 s, 618 under 60 s.
- 2018: 3, 23 and 135.
- 2021: 0, 2 and 35.
For each year in detail: 2015, 2017, 2018, and the three-year comparison in turnout and speed compared.
Data and sources on this site
From the book
This article is based on Chapter VI of Electoral Rights and Election Falsification by Lyudvig Khachatryan, which explains the full method, the formulas and the cases behind it.