Armenia 2017: 668 Polling Stations Faster Than 60 Seconds per Voter
With a cautious limit of 60 seconds per voter, a third of Armenia’s polling stations, with 41% of the voters, reported more voters than they could register in at least one 3-hour window.
Original page on electionscount.info: Elections in Armenia 2017: stations above capacity (60 seconds)The page “Elections in Armenia 2017: polling stations above capacity” takes the official turnout reports of the 2 April 2017 parliamentary elections at 11:00, 14:00, 17:00 and 20:00 and works out how much time each polling station had per voter in every 3-hour window. It lists every station where, in at least one window, voters were registered faster than the limit you enter. The default limit is 60 seconds.
Where the 60 seconds come from
The explanation at the top of the page (in Armenian) defines the voting cycle as the time from the moment a voter hands an identity document to the operator of the identification device until the envelope is dropped into the ballot box, as regulated by Articles 66 and 67 of the Electoral Code. The cycle has four phases: (a) the identity check with the technical device, (b) registration in the signature book and handing out the ballots and the envelope, (c) voting in the booth, and (d) a commission member sticking a self-adhesive stamp on the ballot and the voter dropping the envelope into the box.
Measurements made from the polling-station video recordings published through the Central Electoral Commission showed that phase (b) alone took no less than 70 seconds and the whole cycle on average more than 90 seconds. The page nevertheless uses a more cautious figure: 60 seconds for the single longest operation, assuming the voter causes no delay anywhere else. A station with more than 1,000 voters has two lists and two registration tables, so it can serve two voters in 60 seconds. As the page notes, at that pace a one-table station can receive at most about 180 voters in three hours, and a two-table station about 360.
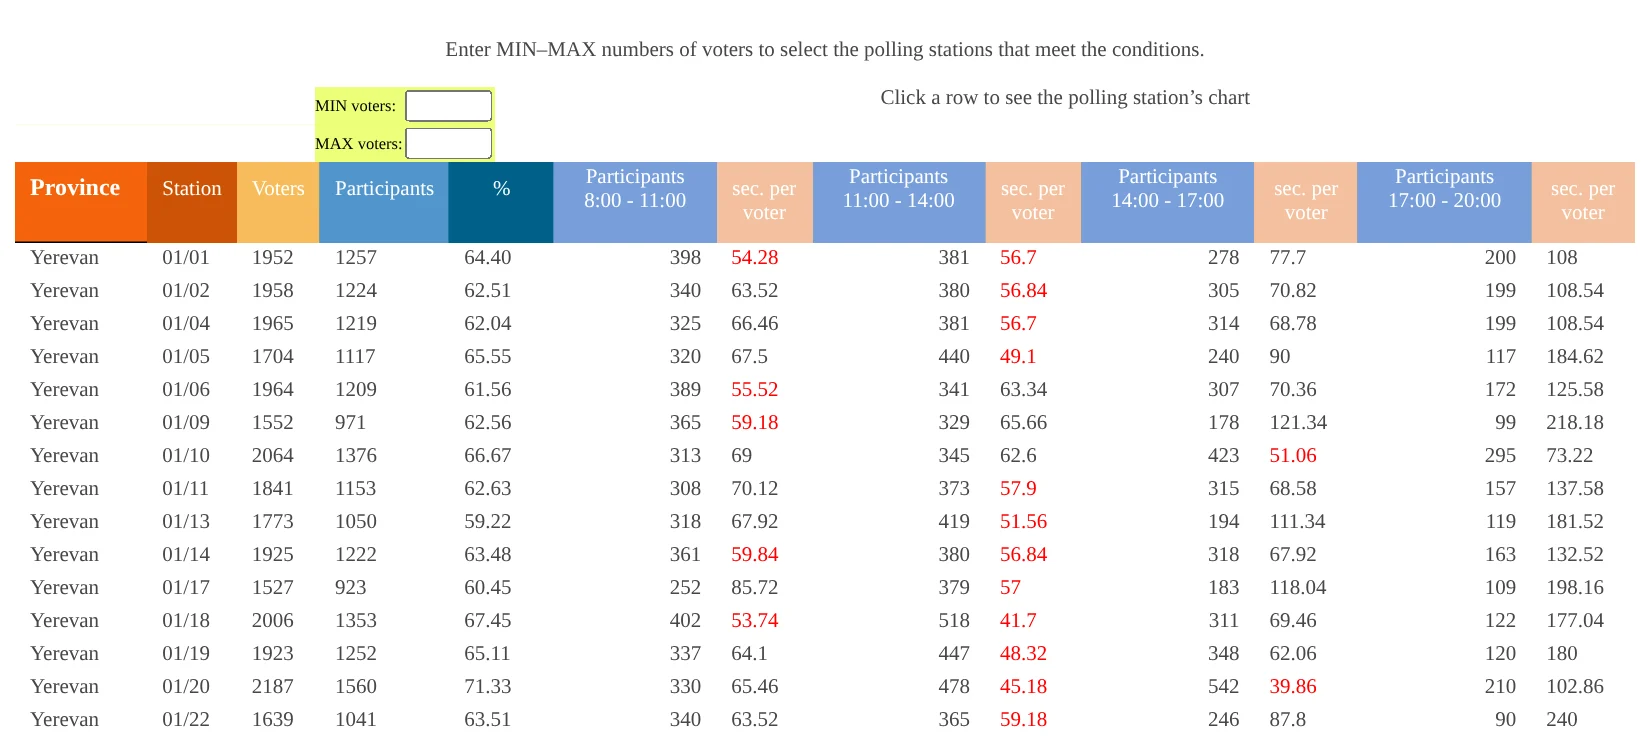
How to read this chart
- Province, Station, Voters, Participants, %: the station and its turnout.
- Participants 8:00–11:00 and so on: how many people voted in each 3-hour window, from the official turnout reports.
- sec. per voter: the time available per voter in that window, taking two tables into account for stations with more than 1,000 voters. Red marks a time at or below the limit.
- MIN / MAX voters: filter the stations by size. Click a row to open the station’s turnout chart.
What it shows
At Avan’s station 01/01, 381 people voted between 11:00 and 14:00 at two tables: 56.7 seconds per voter. At 01/20, 542 voted between 14:00 and 17:00: 39.86 seconds.
The result
With the 60-second limit the page selects 668 polling stations, a third of the 2,009, with 1,070,489 voters (41% of the electorate) and 685,826 participants. Their turnout was 64.07%; in the other 1,341 stations it was 58.6%. Most stations hit the limit in the late-morning window, 11:00–14:00 (436 stations), followed by 14:00–17:00 (180).
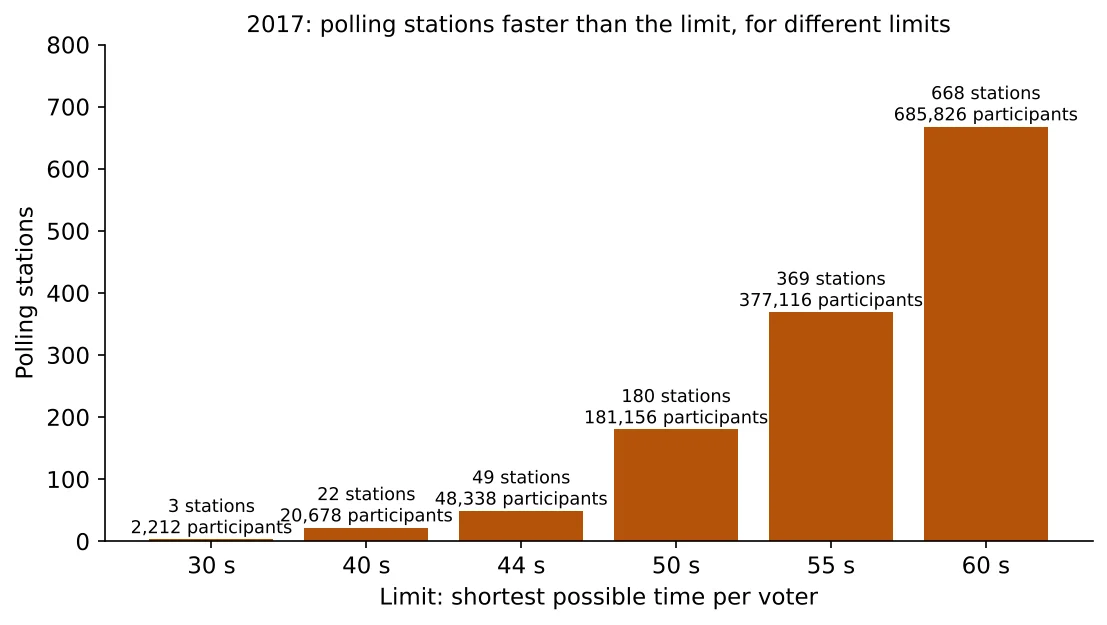
How to read this chart
Each bar is the number of stations the page would list for a given limit; the label also gives their participants. A lower limit is more cautious.
What it shows
- 44 s, the limit used for the other years: 49 stations, 48,338 participants.
- 50 s: 180 stations.
- 60 s: 668 stations.
Even at 40 seconds per voter, 22 stations remain.
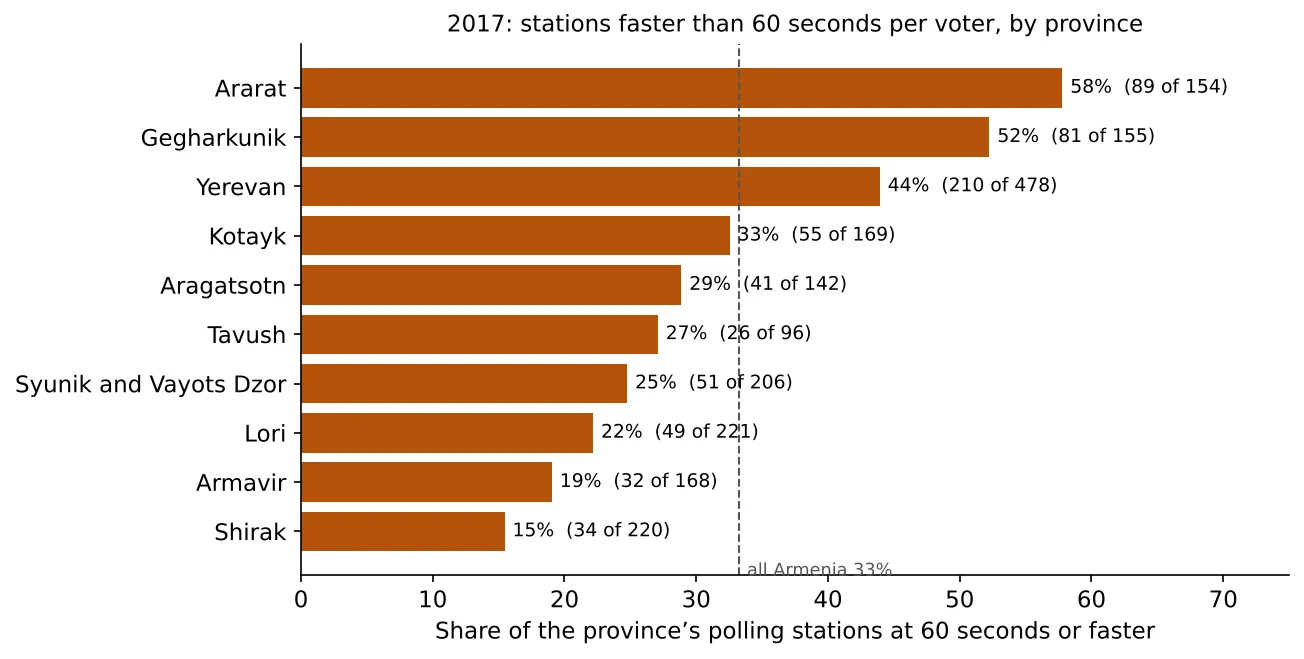
How to read this chart
Each bar is the share of the province’s polling stations that the page lists at 60 seconds; the figures in brackets are the listed stations and all stations. The dashed line is the share for the whole country.
What it shows
Ararat (89 of 154 stations, 58%) and Gegharkunik (81 of 155, 52%) top the list, as Ararat also did in the 2015 referendum. Shirak (15%) and Armavir (19%) have the fewest.
The fastest stations
| Station | Community | Voters | Turnout | Busiest 3 hours | Seconds per voter |
|---|---|---|---|---|---|
| 36/15 | Yelpin (Vayots Dzor) | 986 | 74.75% | 320 voters, 14:00–17:00, one table | 33.75 |
| 17/22 | Ohanavan (Aragatsotn) | 1,952 | 77.00% | 593, 11:00–14:00 | 36.42 |
| 34/43 | Aravus (Syunik) | 946 | 92.81% | 291, 14:00–17:00, one table | 37.11 |
| 13/32 | Ararat (Ararat) | 1,930 | 70.67% | 580, 14:00–17:00 | 37.24 |
| 08/31 | Shengavit (Yerevan) | 1,966 | 63.22% | 576, 11:00–14:00 | 37.50 |
| 35/56 | Kajaran (Syunik) | 1,887 | 83.84% | 573, 11:00–14:00 | 37.70 |
Three listed stations have impossible reports: at 02/49 (Nor Nork) and 13/51 (Kaghtsrashen) the number of participants fell by 61 and 93 in the last window, and at 10/56 (Nubarashen) nobody was reported between 8:00 and 11:00 yet 524 people voted by 20:00. The page marks them with −1 and 0.
Why this matters
If a station reported more participants than it could physically register, the excess signatures were not written by voters standing at the table. The same check for 2018 and 2021, with an adjustable limit, is in the turnout and speed table; the 2017 figures are discussed in turnout and voting speed, 2017, and the method in polling station capacity.
Try it yourself: on the page, type a different number of seconds, for example 44, and the list updates.
Data and sources on this site
From the book
This article is based on Chapter VI of Electoral Rights and Election Falsification by Lyudvig Khachatryan, which explains the full method, the formulas and the cases behind it.