Armenia 1991–2021: Population, Registered Voters and Turnout in 16 Votes
Armenia lost about 630,000 residents between 1991 and 2021, but gained 430,000 registered voters. Participation fell from 95% in 1991 to about half.
Original page on electionscount.info: Numbers of voters and population from 2001 to 2021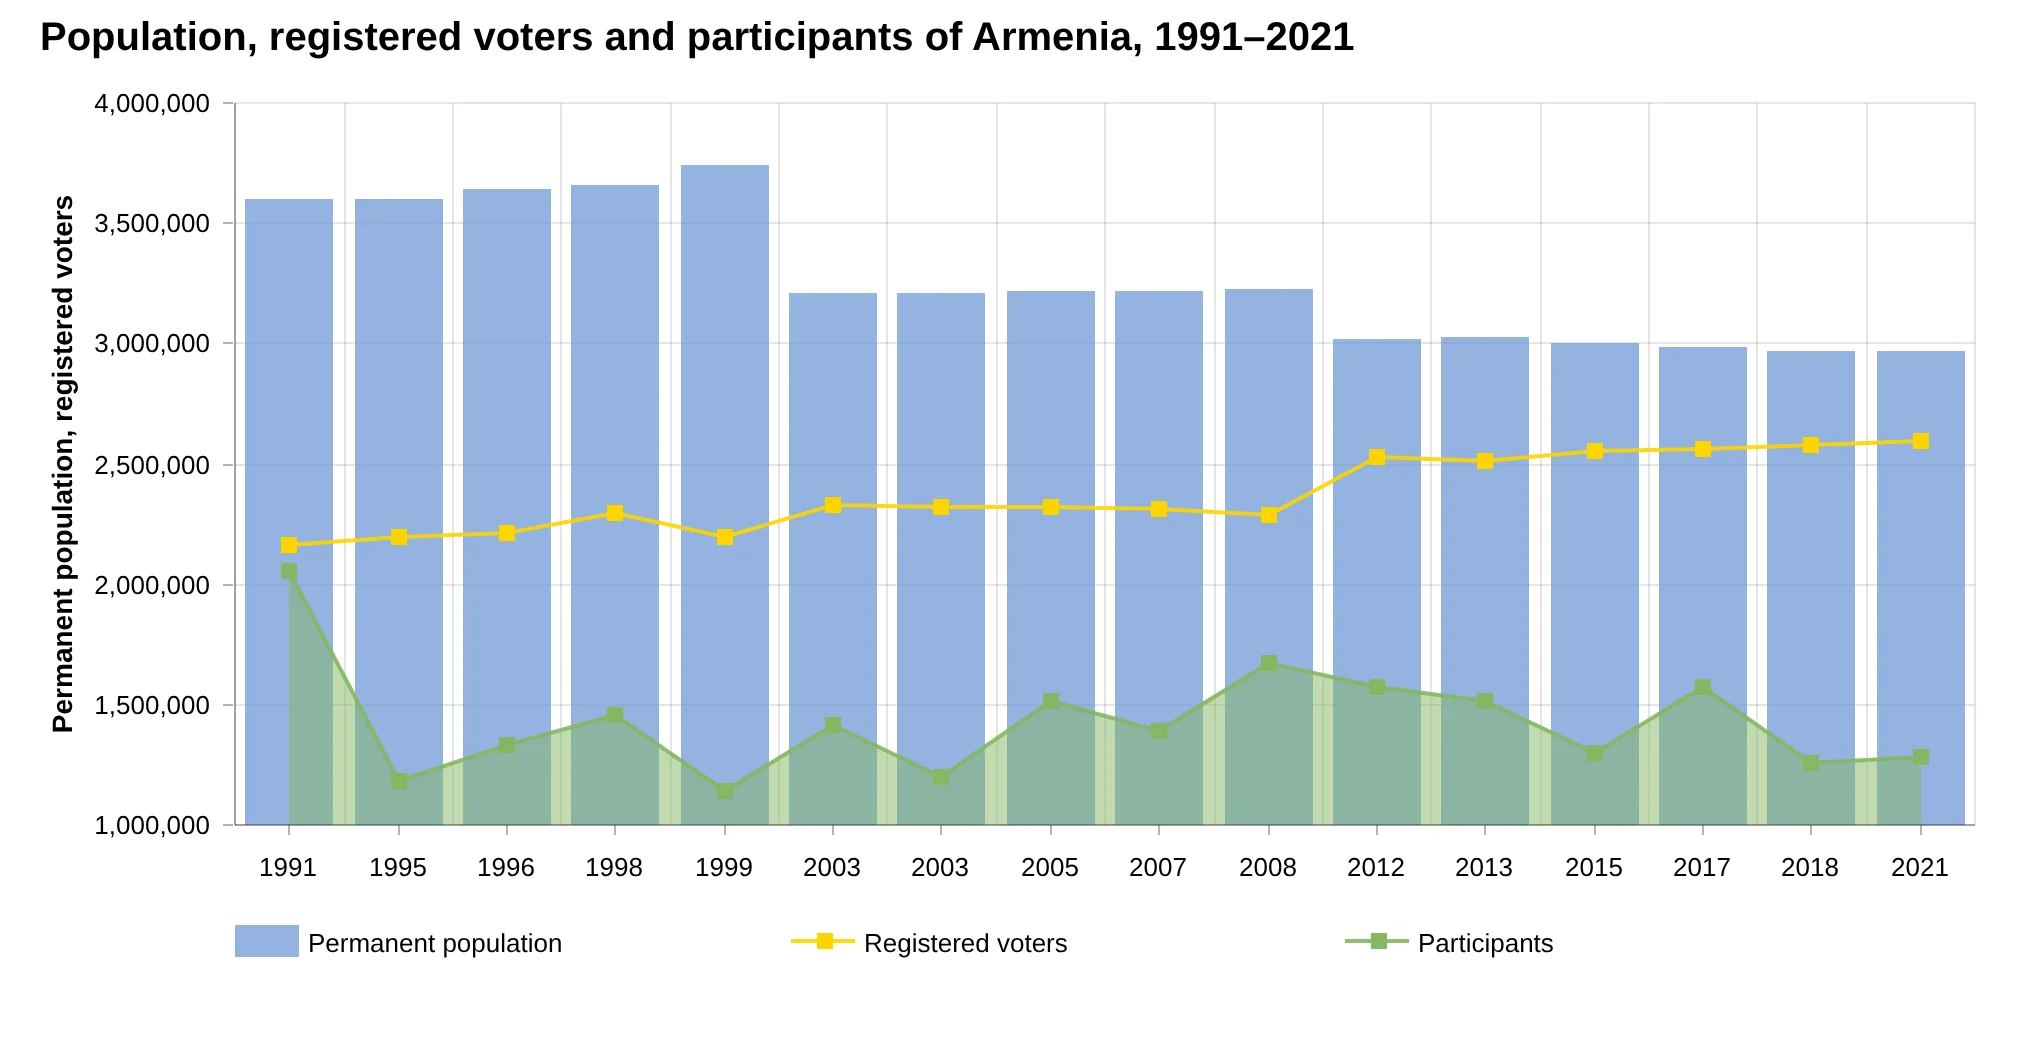
How to read this chart
Blue bars: permanent population. Yellow line: registered voters. Green line and area: people who took part. Each point is one national vote; 2003 appears twice (presidential runoff and parliamentary election).
What it shows
- 1991, independence referendum: 3,600,000 people, 2,163,697 voters, 2,056,758 took part (95%).
- 2008, presidential election: the most participants of any vote since 1991, 1,671,027 (73%).
- 2012: the population figure drops to 3,018,854 after the census, but voters jump to 2,524,960, from 70.8% of the population to 83.6%.
- 2021: 2,967,900 people, 2,594,834 voters (87.4%), 1,281,174 took part (49.4%).
More voters than the population can explain
Voters made up about 60% of the population in the 1990s and 71–73% in the 2000s, but 80–87% from 2012 on. Roughly a fifth of Armenia's population is under 18, so lists at 87% of all residents must include a large number of people who live abroad. The book explains why this matters: every absent voter who stays on the list is a signature that someone else can put in their place. Compare the voter-list changes in the 2003 example.
The other line tells a second story: participation fell from 1.67 million in 2008 to 1.26–1.30 million in 2015, 2018 and 2021, even as the lists grew. When the lists grow and real participation falls, the gap between them is the space in which fake turnout can hide.
Data and sources on this site
From the book
This article is based on Chapters IV and VI of Electoral Rights and Election Falsification by Lyudvig Khachatryan, which explains the full method, the formulas and the cases behind it.