Armenia 2018: Population, Voters and Turnout by Province
Armenia's population fell after 2008, but the number of registered voters grew. In the 2018 snap election turnout was moderate everywhere, with no province far ahead.
Original page on electionscount.info: Numbers of voters and population from 2001 to 2018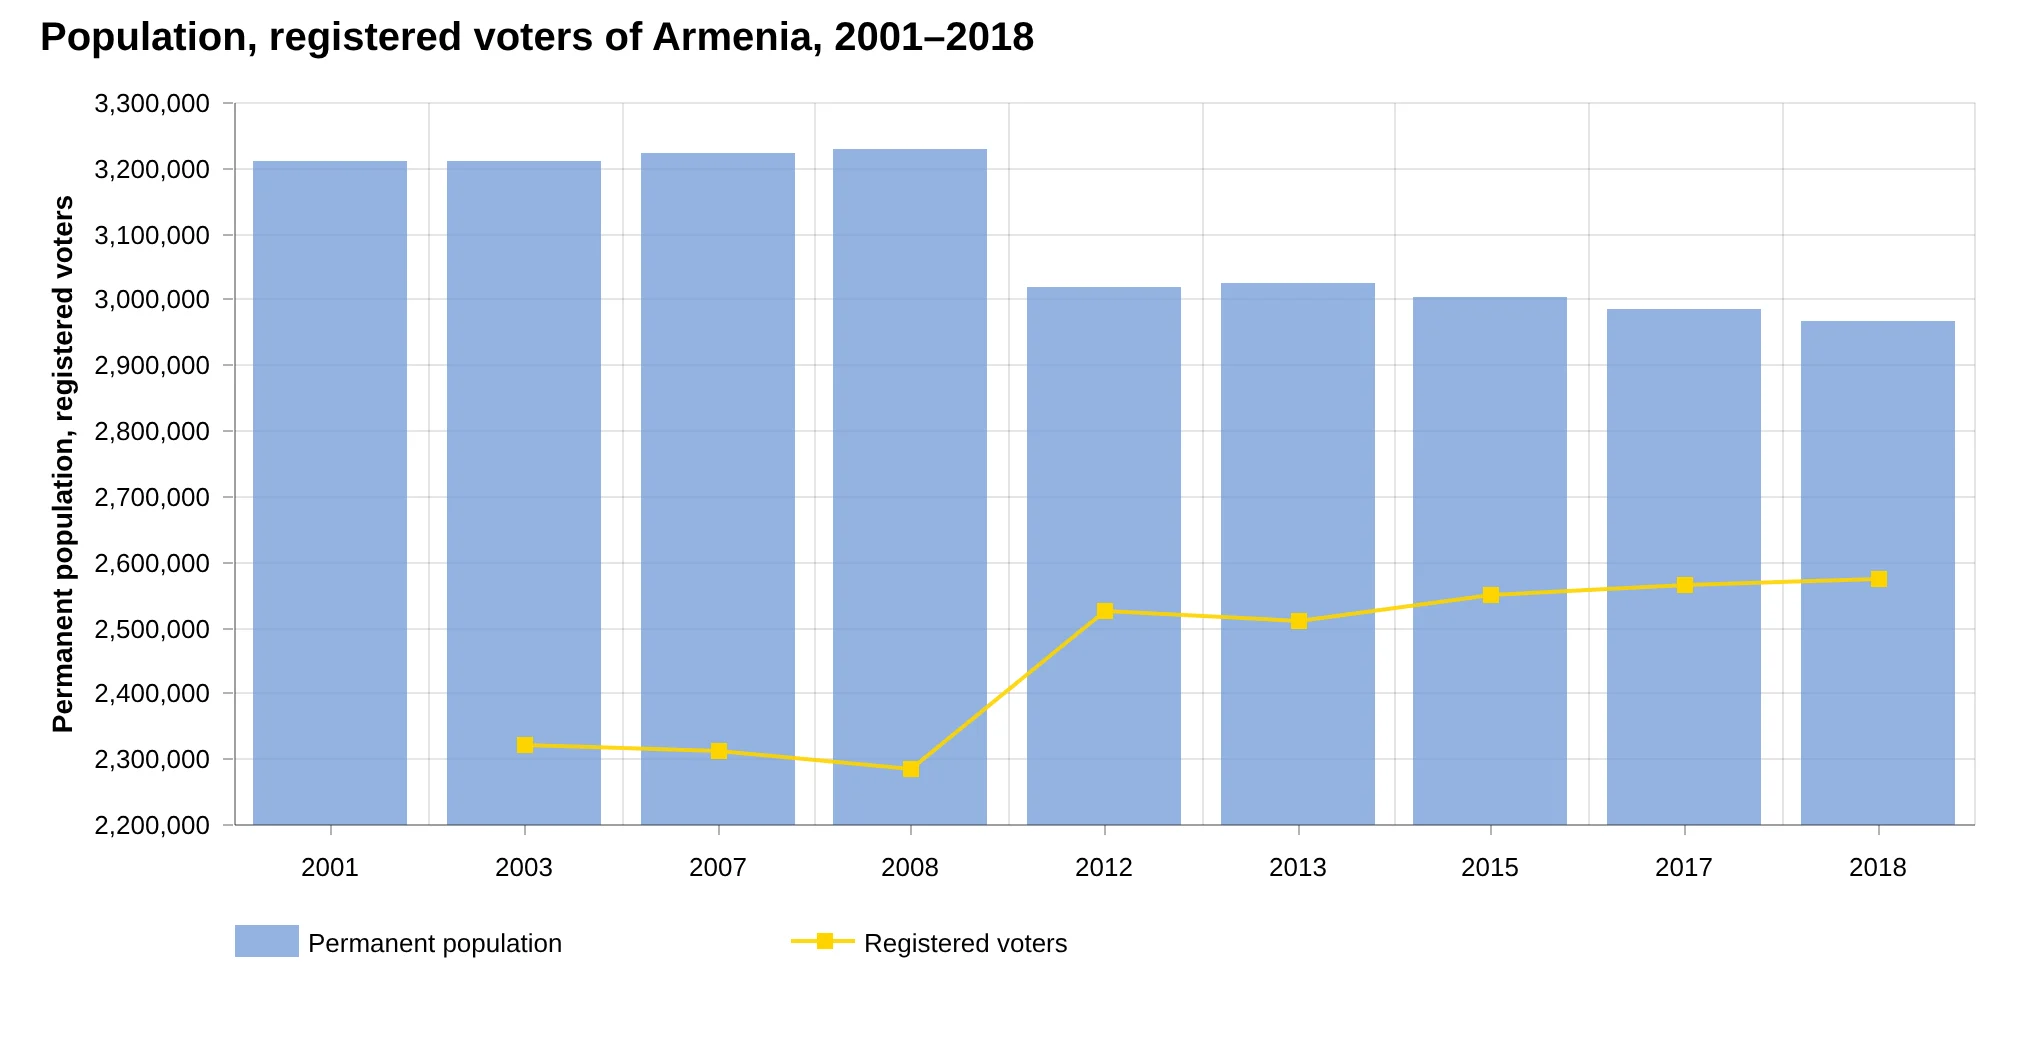
How to read this chart
Blue bars: permanent population. Yellow line: registered voters. Each point is an election year.
What it shows
In 2003 Armenia had 3,210,300 people and 2,322,614 voters, 72.35% of the population. By 2018 the population had fallen to 2,969,200, yet the voters had grown to 2,574,916, or 86.7% of the population. The jump came in 2012, when the population figure dropped to 3,018,854 after the census and voters rose to 2,524,960.
Children and teenagers are about a fifth of the population, so voter lists close to 87% of all residents suggest that many people who live abroad stay on the lists. Those names are what makes voting on behalf of others possible.
How to read this chart
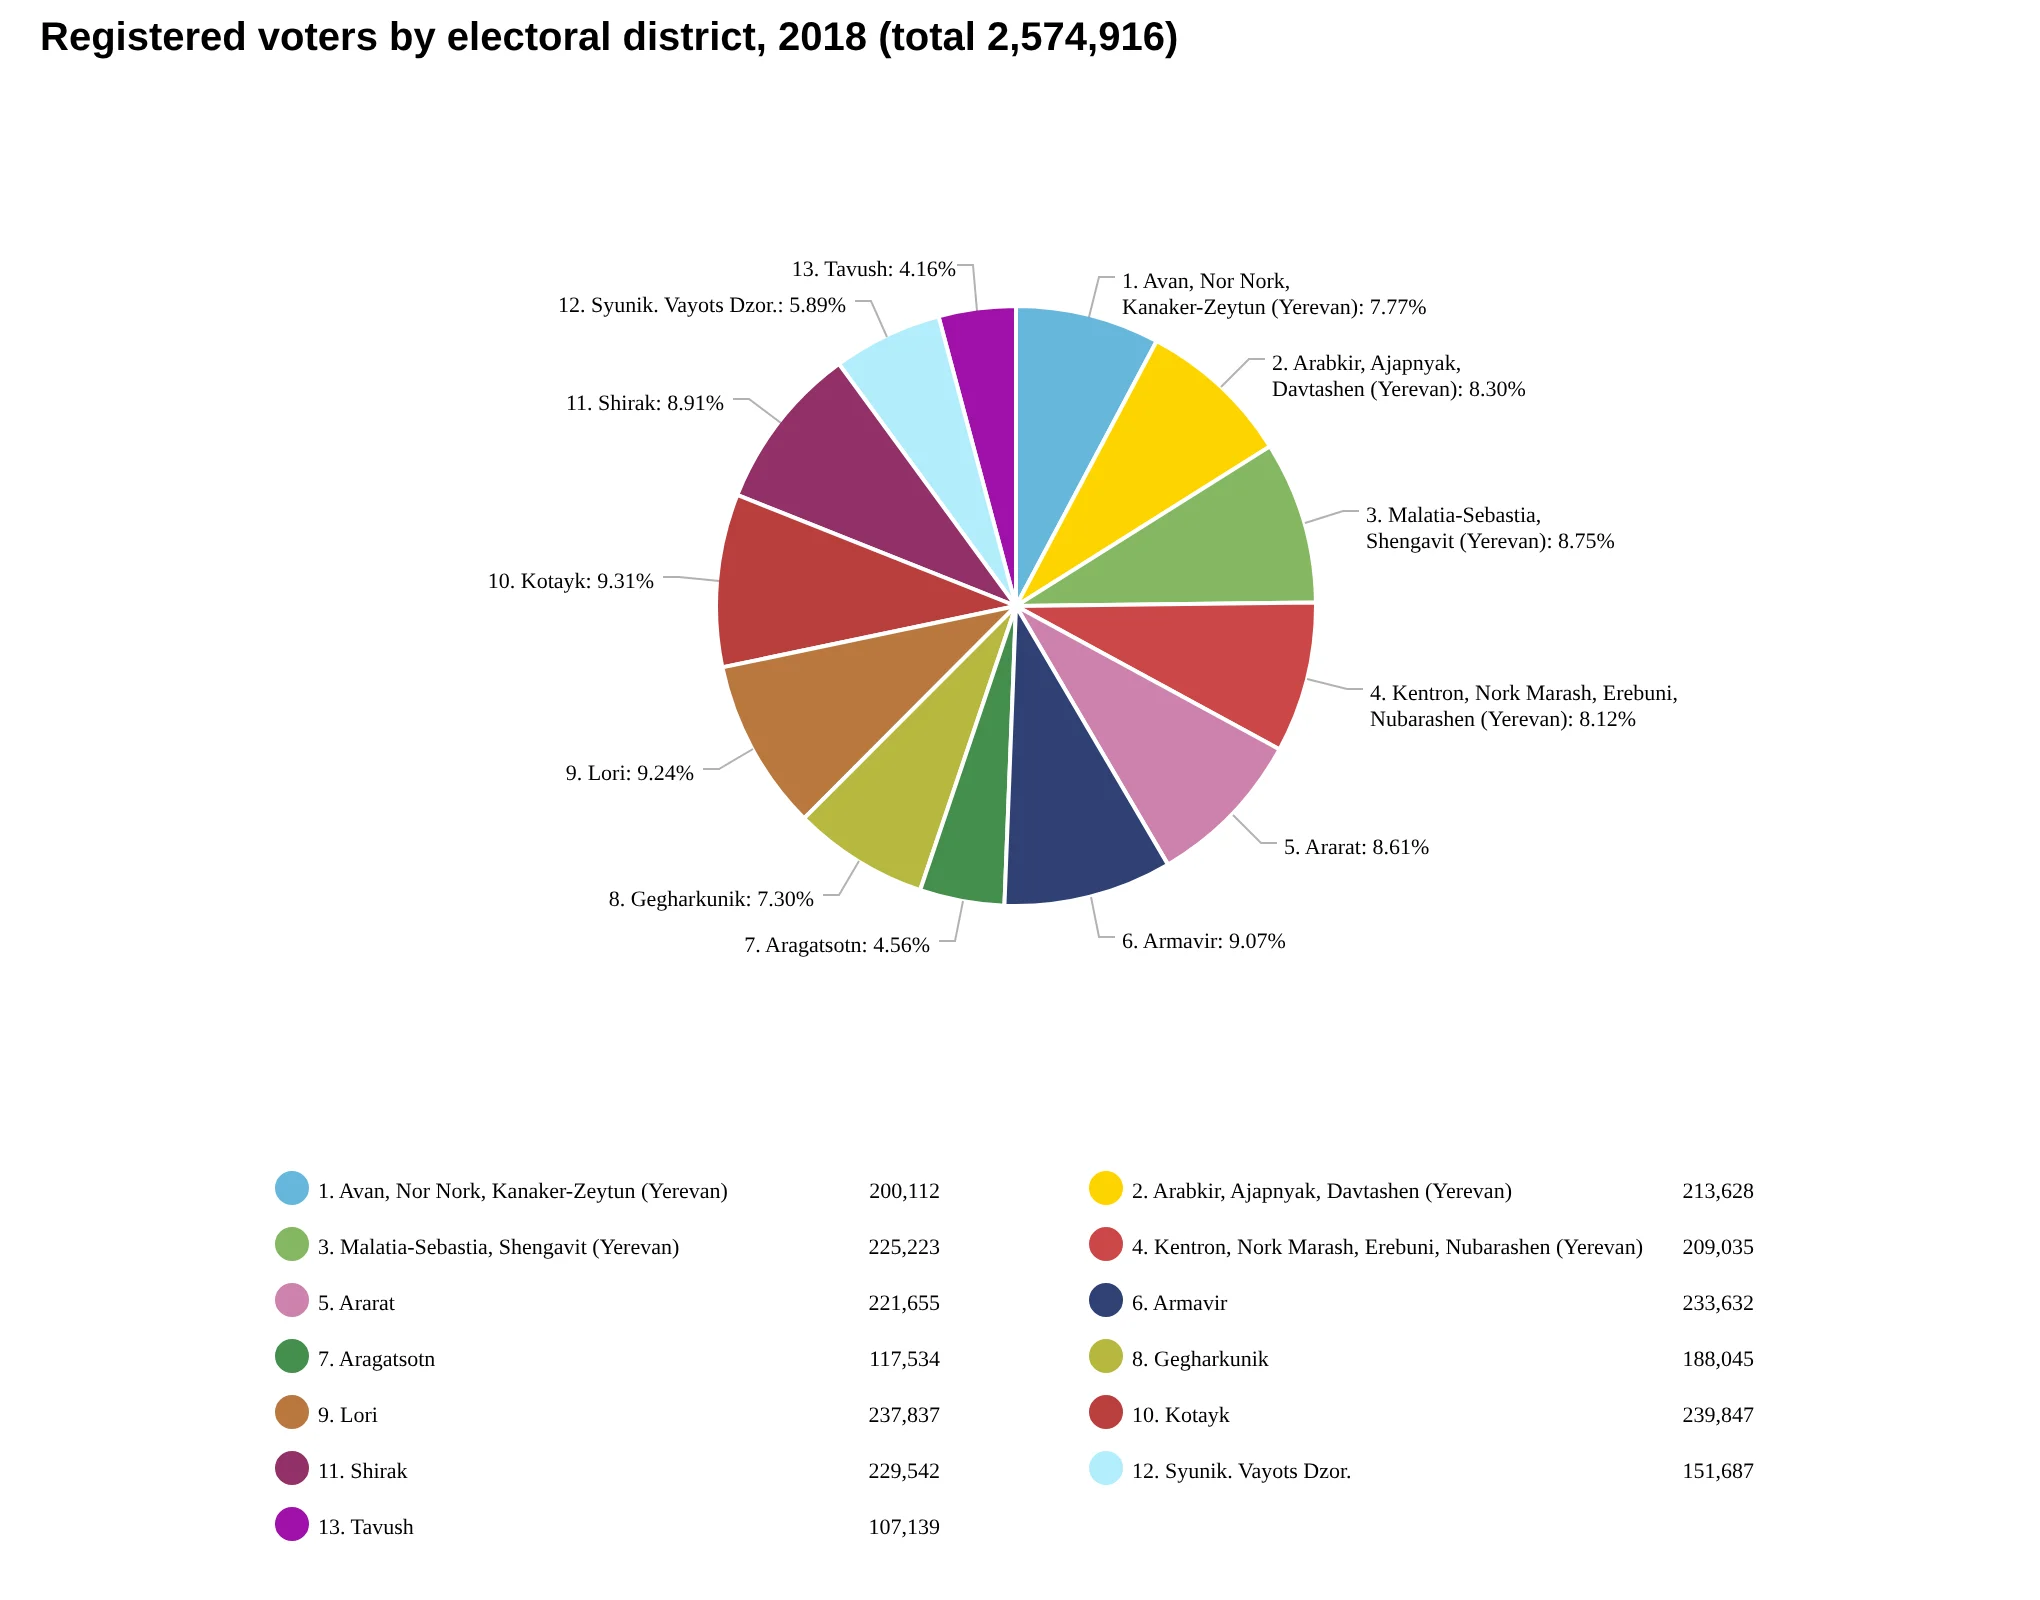
The 2,574,916 voters of 2018 split into the 13 electoral districts of the 2016 Electoral Code: four in Yerevan and nine in the provinces. Each slice is one district.
What it shows
The four Yerevan districts are almost equal, 7.8–8.8% each, together about a third of the country. The largest provincial districts are Kotayk (9.31%), Lori (9.24%) and Armavir (9.07%); the smallest are Aragatsotn (4.56%) and Tavush (4.16%). Syunik and Vayots Dzor form one district together (5.89%).
How to read this chart
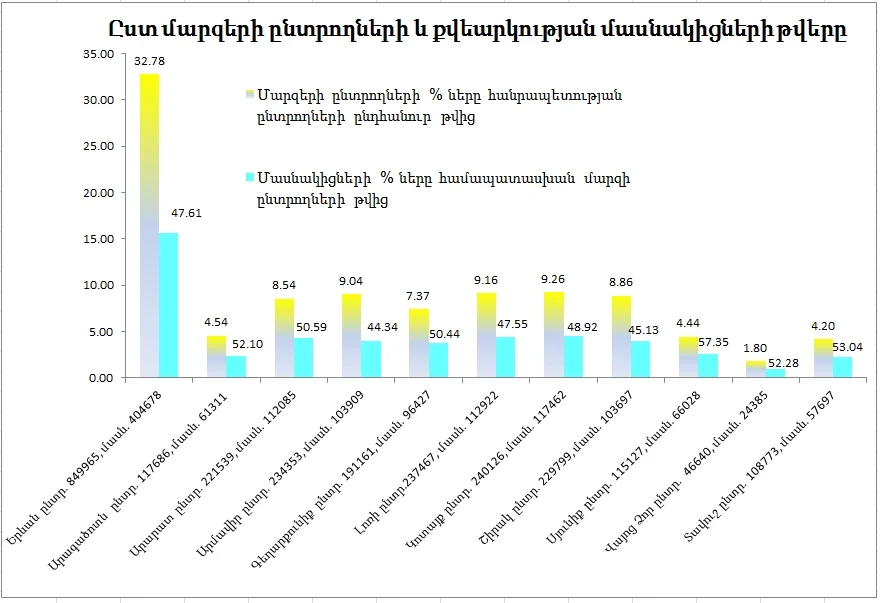
Two bars per province. Yellow: the province's share of all voters in Armenia. Cyan: turnout in that province. Under each name are its voters and participants.
What it shows
Yerevan has 32.78% of all voters (849,965) and turnout of 47.61%. Turnout in the provinces ranged from 44.34% in Armavir to 57.35% in Syunik. Compare 2015, when it ranged from 41.27% in Shirak to 66.49% in Ararat: in 2018 Ararat had 50.59%, sixteen points less, and Armavir 44.34% instead of 56.03%.
Key to the Armenian labels: Ըստ մարզերի ընտրողների և քվեարկության մասնակիցների թվերը = voters and participants by province; Մարզերի ընտրողների % = province's share of all voters; Մասնակիցների % = turnout; ընտր. = voters; մասն. = participants.
Why 2018 looks different
The narrow range of turnout in 2018 is itself a finding. In the 2015 referendum the provinces with high turnout were the same ones where turnout rose above the physical capacity of polling stations. In the December 2018 snap election, held months after the change of government, those spikes mostly disappeared, which is what the method expects when the pressure behind them goes away.
Data and sources on this site
From the book
This article is based on Chapter VI of Electoral Rights and Election Falsification by Lyudvig Khachatryan, which explains the full method, the formulas and the cases behind it.