Armenia 2015 Referendum: Results by the Party of the Polling-Station Chair
Where the polling station was chaired by the ruling RPA, YES reached 33.6% of voters; where the chair came from the opposition ANC, 26.4%. NO hardly changed.
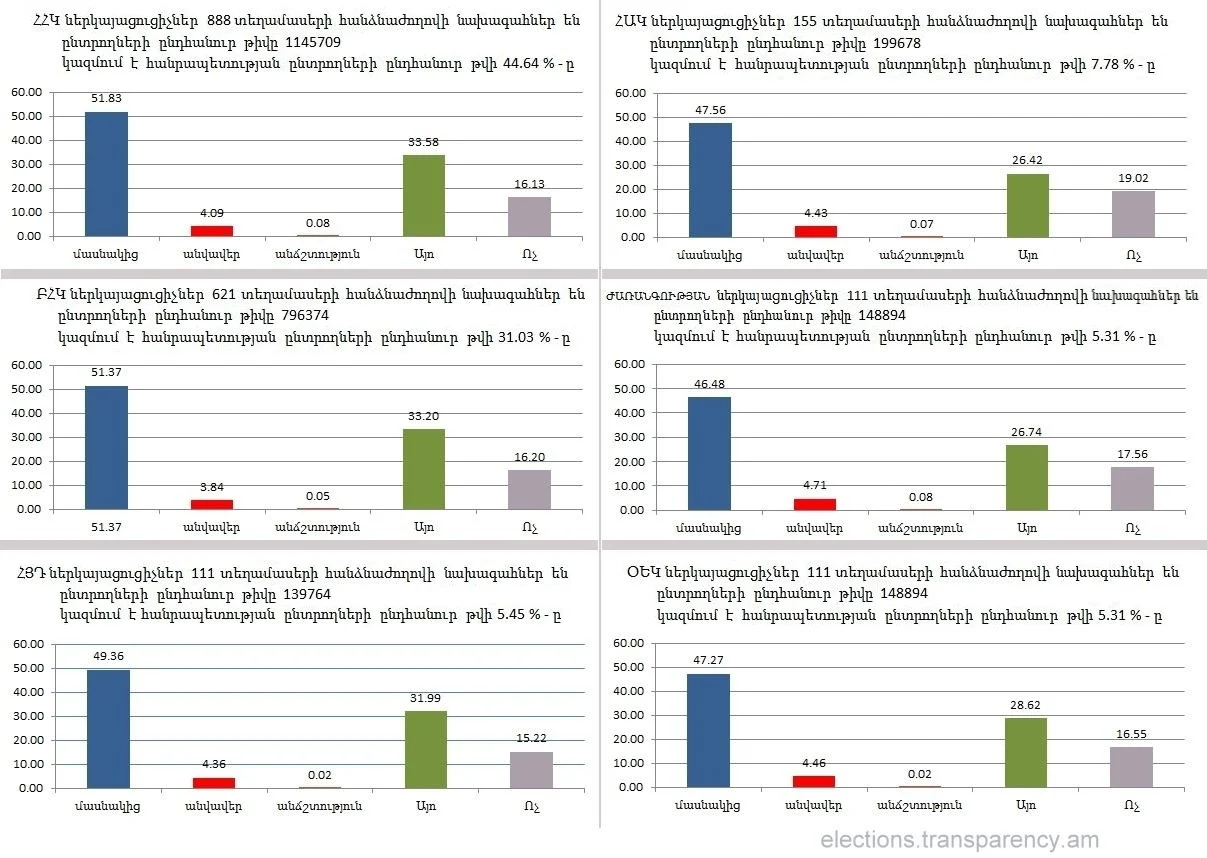
Original page on electionscount.info: Distribution of votes by the party of the precinct chair, 2015 (chart)Every precinct commission in 2015 had a chair nominated by one of the six parties then in parliament. The chart “Distribution of votes by the party of the precinct chair” groups the polling stations by that party and shows the results of each group as a share of its registered voters.

How to read this chart
There is one panel per party. The heading says: “[Party] representatives are chairs of [N] precinct commissions; the total number of voters is [V], which is [X]% of all voters of the republic.”
- մասնակից (blue): participants, turnout.
- անվավեր (red): invalid ballots.
- անճշտություն: inaccuracies recorded in the protocols.
- Այո (green): YES.
- Ոչ (grey): NO.
All bars are % of registered voters. Parties: ՀՀԿ = Republican Party (RPA); ՀԱԿ = Armenian National Congress (ANC); ԲՀԿ = Prosperous Armenia; ԺԱՌԱՆԳՈՒԹՅՈՒՆ = Heritage; ՀՅԴ = ARF Dashnaktsutyun; ՕԵԿ = Rule of Law (Orinats Yerkir).
What it shows
RPA chairs led 888 stations with 44.64% of all voters, Prosperous Armenia 621 with 31.03%. The other four parties had 111 to 155 stations each.
How to read this chart
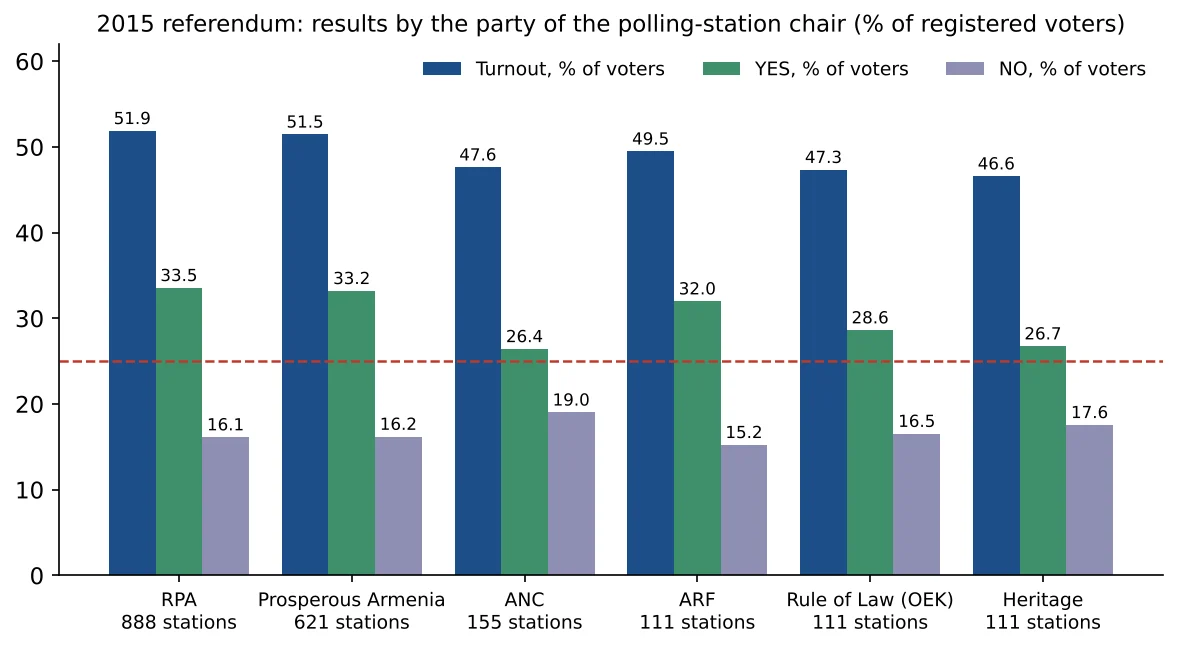
Three bars per party: turnout, YES and NO, each as % of the registered voters at the stations that party chaired. The dashed line is 25% of voters.
What it shows
| Chair’s party | Stations | Turnout | YES | NO |
|---|---|---|---|---|
| RPA | 888 | 51.9 | 33.6 | 16.1 |
| Prosperous Armenia | 621 | 51.5 | 33.2 | 16.2 |
| ARF | 111 | 49.5 | 32.0 | 15.2 |
| Rule of Law | 111 | 47.3 | 28.6 | 16.5 |
| Heritage | 111 | 46.6 | 26.7 | 17.6 |
| ANC | 155 | 47.6 | 26.4 | 19.0 |
Where the chair came from the ruling RPA or its then partners, turnout was 4–5 points higher and YES 6–7 points higher than where the chair came from the opposition ANC or Heritage, while NO hardly changed.
What the difference means
In 2015 the RPA, ARF and, at the time, Prosperous Armenia supported the new constitution; the ANC and Heritage campaigned against it. A chair cannot change how people vote, but a chair decides how strictly the count is run. If the stations chaired by opponents of the draft had been a fair sample of the country, the gap could be a matter of geography. The pattern, however, is the same as in the turnout splits: NO stays at 15–19% of voters in every group, and only turnout and YES move together.
Measured as a share of participants, YES reached 64.7% at RPA-chaired stations and 64.5% at Prosperous Armenia’s, against 55.5% at ANC-chaired and 57.4% at Heritage-chaired stations.
The share of stations with a protocol mismatch, from the protocol checks, is lower under RPA chairs (29%) than under ANC chairs (37%). As noted there, a protocol that adds up only shows that the numbers were made to agree.
Two errors on the chart
- The Heritage and Rule of Law panels both give 148,894 voters and 5.31%. The polling-station table gives 136,363 voters (5.31%) for Heritage-chaired stations and 148,891 (5.80%) for Rule of Law. So the Heritage panel has Rule of Law’s voter number, and the Rule of Law panel has Heritage’s percentage.
- In the Prosperous Armenia panel, the label of the first bar reads “51.37” instead of “մասնակից” (participants).
The percentages on the chart differ from today’s table by a few hundredths of a point, because the chart was made from an earlier version of the data. None of this changes the comparison.
You can filter the stations by the chair’s party yourself in the final results table or the table of YES and NO as % of participants.
Data and sources on this site
From the book
This article is based on Chapter VI of Electoral Rights and Election Falsification by Lyudvig Khachatryan, which explains the full method, the formulas and the cases behind it.