Armenia 2015 Referendum: YES at Each Polling Station as a Share of Voters and of Participants
At 663 polling stations with over a million voters, YES was less than a quarter of the electorate. In the big cities it did not even win a majority of those who voted.
Original page on electionscount.info: Distribution of votes by polling station: YES and NO as % of voters, 2015Under the rules of the 6 December 2015 referendum on constitutional amendments, the draft was adopted if more than half of the participants voted YES and the YES votes were at least one quarter of all registered voters. The second condition is why the site so often shows YES and NO as a share of voters rather than of participants.
Two linked pages show every polling station of the referendum. The first gives YES and NO as a share of registered voters, with the station’s address. The second gives YES and NO as a share of participants, with the number of polling stations in the community and the party of the station chair. A button at the top of each page switches to the other.
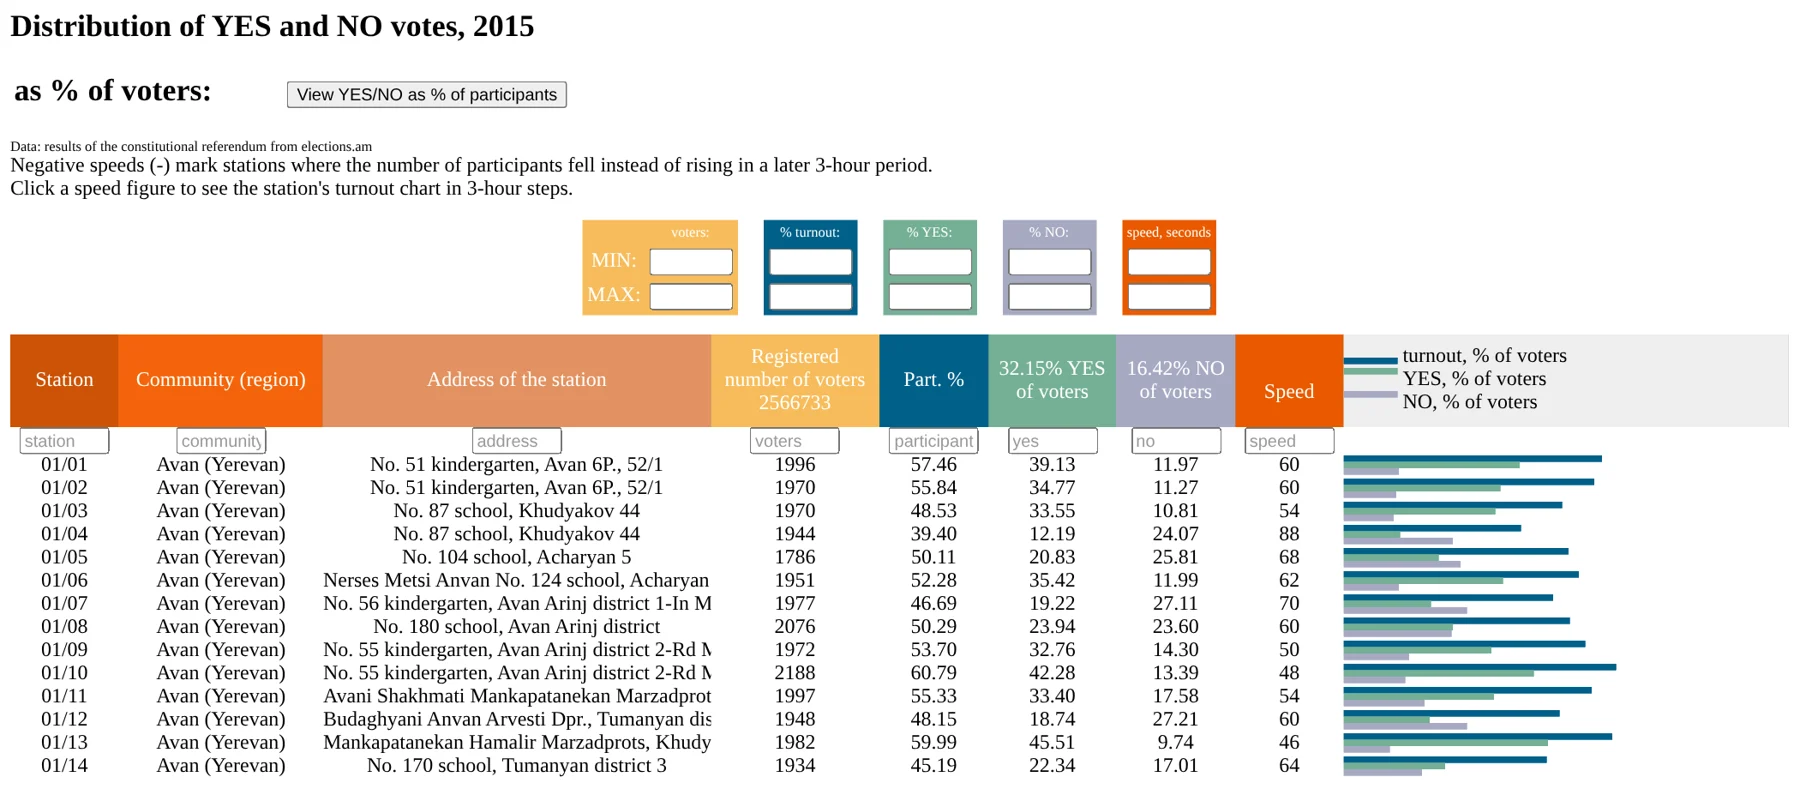
How to read this chart
- Station, Community (region), Address.
- Registered number of voters and Part. % (turnout).
- YES, NO: as % of registered voters; the header shows the national 32.15% and 16.42%.
- Speed: fastest registration time in a 3-hour window, seconds per voter; click it for the station’s turnout chart. Negative values mark stations where turnout fell between two reports.
- Bars: turnout, YES and NO as % of voters for each row.
- MIN / MAX: filter by voters, turnout, YES, NO or speed.
What it shows
At the first station, 01/01 in Avan, 57.46% voted, 39.13% of all voters said YES and 11.97% NO. At 01/04 only 12.19% of voters said YES.
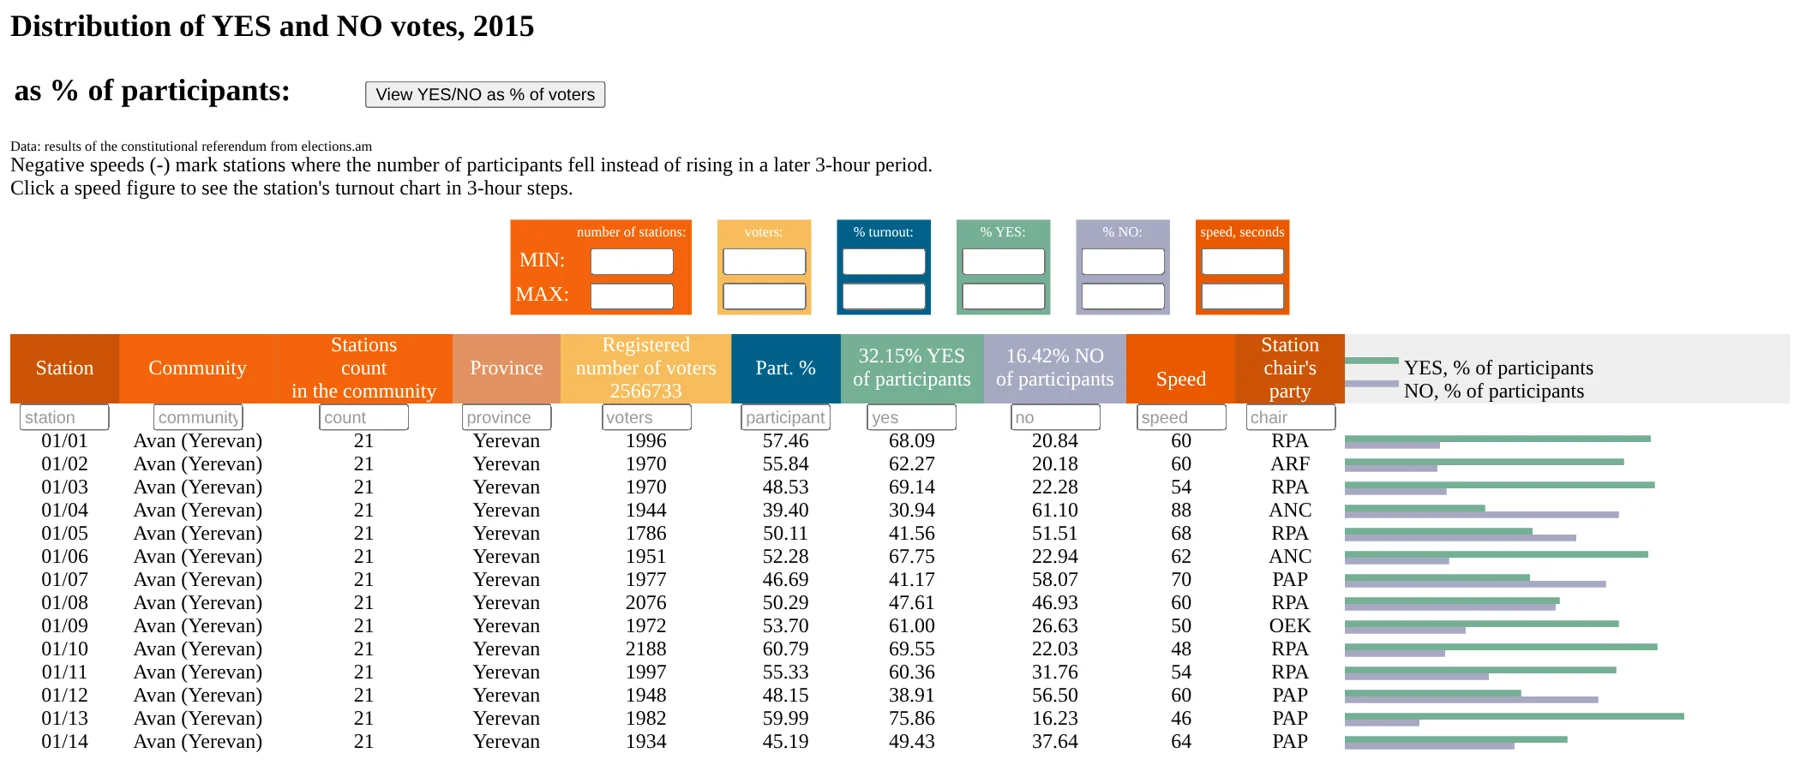
How to read this chart
- Stations count in the community: how many polling stations the community has. 1 means a village with a single station.
- YES, NO: as % of participants.
- Station chair’s party: RPA (ՀՀԿ), PAP = Prosperous Armenia (ԲՀԿ), ANC (ՀԱԿ), ARF (ՀՅԴ), OEK = Rule of Law (ՕԵԿ), Heritage (ԺԱՌԱՆԳ.).
- The MIN / MAX field “number of stations” filters communities by size.
What it shows
The same station 01/01 now reads 68.09% YES and 20.84% NO. Station 01/04, chaired by an ANC member, gave NO 61.10%. (The header of this page repeats the shares of voters, 32.15% and 16.42%; the shares of participants are 63.37% and 32.37%.)
Two ways of counting, two different pictures
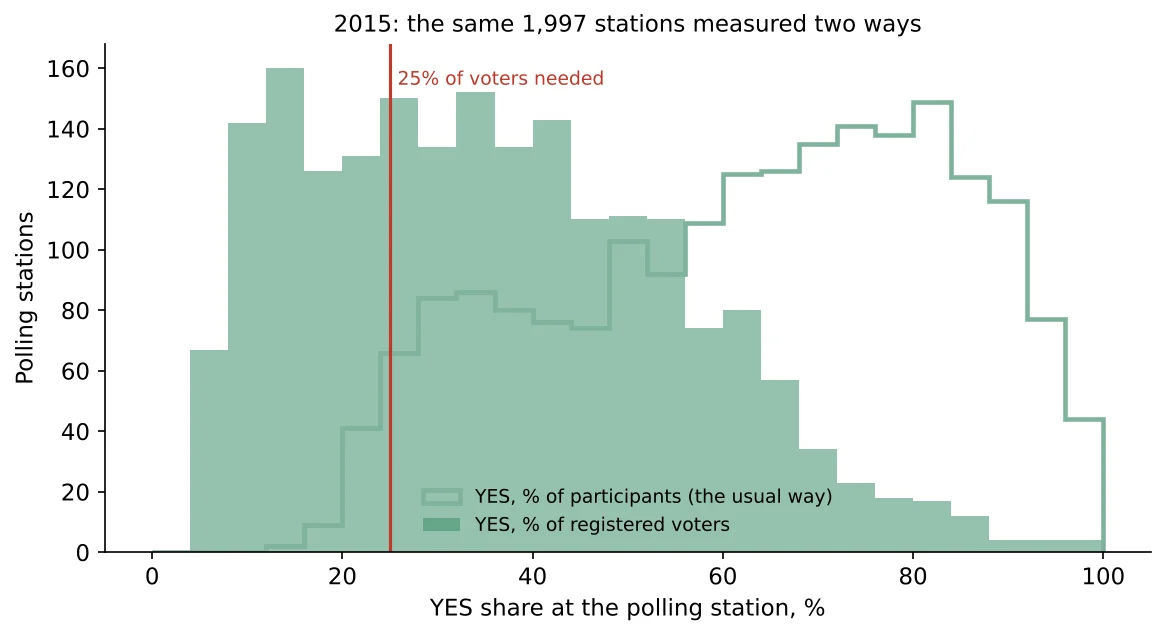
How to read this chart
The horizontal axis is the YES share at a station, the vertical axis the number of stations in each 4-point band. The outlined curve uses the share of participants, the filled area the share of registered voters. The red line marks 25% of voters.
What it shows
As a share of participants most stations sit between 50% and 90% YES: the draft looks comfortably adopted. As a share of registered voters the bulk shifts left, and 663 stations with 1,040,254 voters are below the 25% line. At 489 stations NO was larger than YES.
A share of participants hides how many people stayed at home. The law asked for a quarter of all voters, and at a third of the stations, with 41% of the electorate, YES did not get there.
Big communities and small ones
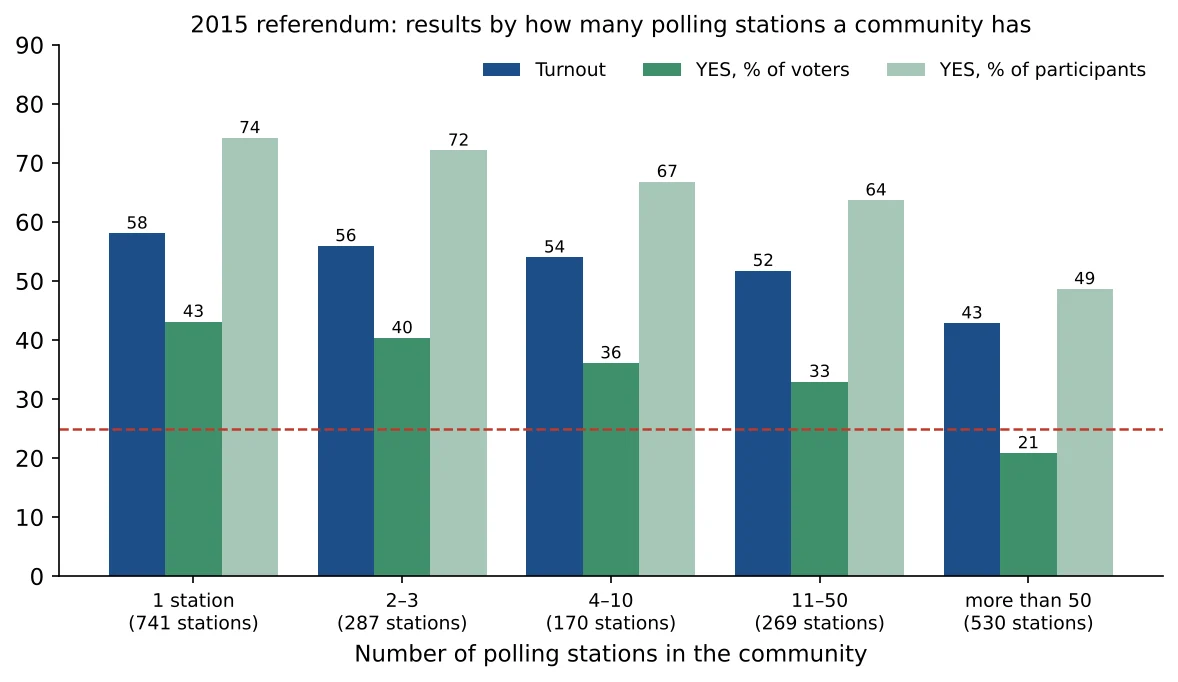
How to read this chart
Stations are grouped by how many stations their community has, from villages with a single station to the large cities and Yerevan districts with more than 50. For each group: turnout, YES as % of voters and YES as % of participants.
What it shows
- 741 single-station villages: turnout 58.1%, YES 74.2% of participants and 43.1% of voters.
- 530 stations in communities with more than 50 stations: turnout 42.9%, YES 48.7% of participants, less than half, and 20.9% of voters.
In the large cities, YES won neither a majority of participants nor a quarter of voters. The national result was made in the villages.
A village with a single polling station has no neighbouring station to compare with, and its commission counts with fewer observers. In cities, where one station sits next to another, results can be checked against each other and are harder to change.
Try it yourself
- On the participants page, set “number of stations” MIN and MAX to 1 to list the single-station villages, and add MIN 90 for YES.
- On the voters page, set MAX 25 for YES to see every station where the draft fell short of the quarter.
- Click any speed figure to see how the station’s turnout grew through the day.
The results by the chair’s party are in votes by the party of the station chair.
Data and sources on this site
From the book
This article is based on Chapter VI of Electoral Rights and Election Falsification by Lyudvig Khachatryan, which explains the full method, the formulas and the cases behind it.