Armenia 2015 Referendum: 134 Communities Where YES Fell Short of a Quarter of Voters
In 134 communities with 40% of Armenia’s voters, YES did not reach a quarter of the electorate; in the 20 largest cities and districts together it reached only 24.5%.
Original page on electionscount.info: Voting results by community, 2015Under the rules of the 6 December 2015 referendum on constitutional amendments, the draft was adopted if more than half of the participants voted YES and the YES votes were at least one quarter of all registered voters. The second condition is why the site so often shows YES and NO as a share of voters rather than of participants.
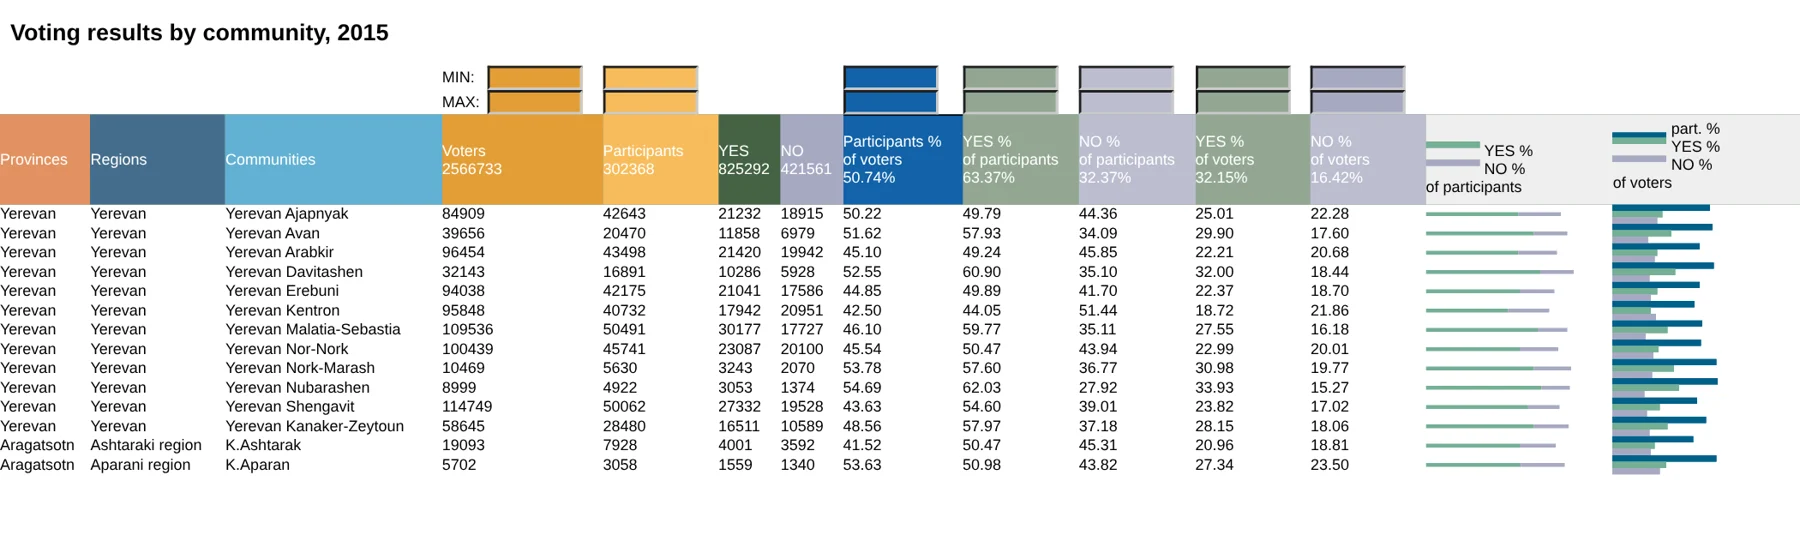
The page “Voting results by community, 2015” lists all 924 communities, the cities, Yerevan districts and villages, with their voters, participants, YES and NO votes, and five percentages. Small bar charts on the right show the shares for each row. The charts of the same data for each province are explained in results by community; this article is about the table itself.
How to read this chart
- Provinces, Regions, Communities: where the community is. Yerevan’s districts are listed as communities.
- Voters, Participants, YES, NO: numbers of people and votes.
- Participants % of voters: turnout.
- YES %, NO % of participants: the usual result.
- YES %, NO % of voters: the result as a share of everyone on the list; compare YES with 25%.
- MIN / MAX fields: filter by any number, for example YES % of voters with MAX 25.
- Bars: left, YES and NO as % of participants; right, turnout, YES and NO as % of voters.
What it shows
The header row gives the national totals: 2,566,733 voters, 825,292 YES, 421,561 NO, turnout 50.74%, YES 63.37% of participants and 32.15% of voters. (The participants total in the header reads “302368”; the full figure is 1,302,368.)
Where YES did not reach a quarter of the voters
In 134 communities, with 1,024,061 voters (40% of the electorate), YES was less than 25% of registered voters. Taken together, turnout there was 41.4%, YES 19.6% of voters and NO 19.4%: the two sides were almost equal. In the other 790 communities turnout was 57.0% and YES 40.5% of voters.
The 134 include most big towns: Gyumri (YES 13.3% of voters), Vanadzor (13.1%), Yerevan’s Kentron (18.7%), Arabkir, Erebuni, Nor-Nork and Shengavit (22–24%), Hrazdan (24.7%), Ashtarak, Alaverdi, Dilijan and Ijevan.
In 67 communities NO won outright. Among them are the second and third cities, Gyumri (NO 52.5% of participants) and Vanadzor (59.7%), Yerevan’s Kentron district (51.4%), Ijevan, and dozens of villages, most of them in Shirak and Lori.
Size of the community
How to read this chart
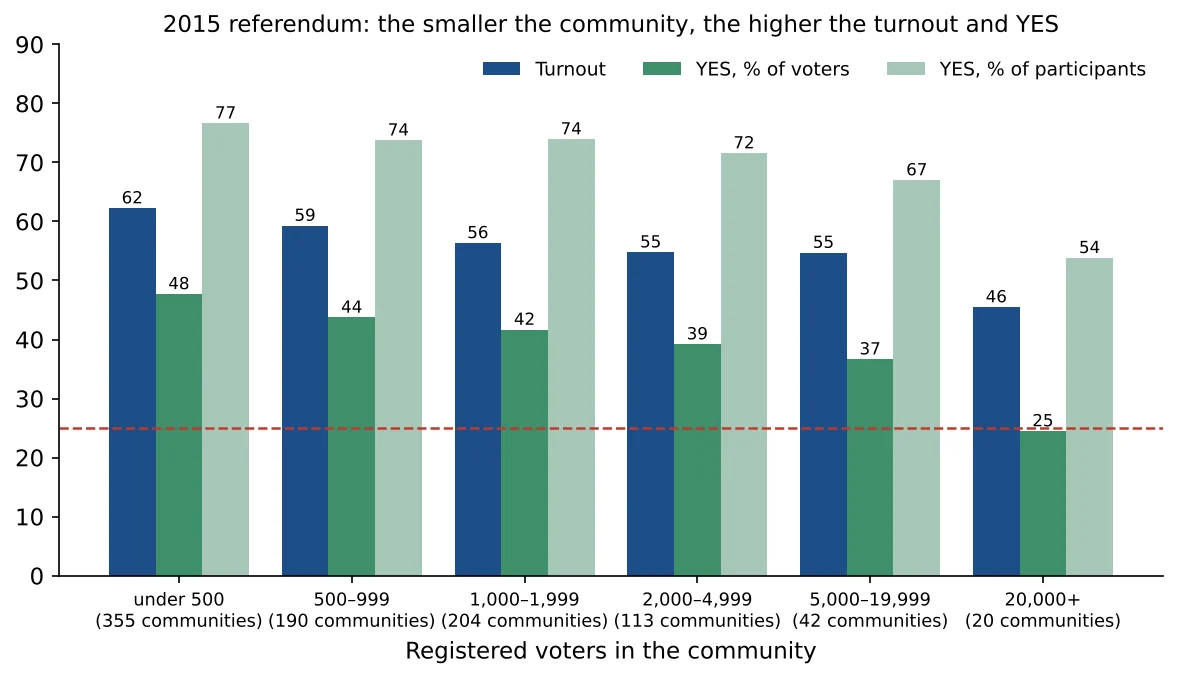
The 924 communities are grouped by their number of registered voters. For each group, the three bars give turnout, YES as % of registered voters and YES as % of participants. The dashed red line is 25% of voters.
What it shows
- Under 500 voters (355 villages): turnout 62%, YES 77% of participants, 48% of voters.
- 20,000 voters or more (20 cities and Yerevan districts, half of the electorate): turnout 46%, YES 54% of participants, 24.5% of voters, below the quarter.
Every step down in size brings higher turnout and a higher YES share.
In the cities, where most voters live and where observers and proxies are easier to find, YES did not reach a quarter of the voters. The draft passed on the votes of small communities, where control of the count is weakest.
Extremes
16 communities reported turnout of 90% or more, among them Nerkin Khndzoresk (97.6% turnout, 99.88% YES), Aygavan (96.3%, 89.8%), Shaghap, Kut, Sisavan, Surenavan and Avshar. In 50 communities YES had 95% of participants or more. Vagharshapat, a town of 44,773 voters, reported 72.9% turnout and 77.4% YES, while neighbouring cities of similar size reported 40–50% turnout.
Try it yourself: on the page, type 25 in the MAX field above “YES % of voters” to list every community where the draft did not reach the quarter, or 80 in the MIN field above turnout to list the communities with 80% turnout or more.
Data and sources on this site
From the book
This article is based on Chapter VI of Electoral Rights and Election Falsification by Lyudvig Khachatryan, which explains the full method, the formulas and the cases behind it.