2015 Referendum in Armenia by Community: Turnout and YES in 924 Towns and Villages
Province by province, the towns had moderate turnout and split votes, while many villages reported 80–100% turnout and almost unanimous YES.
Original page on electionscount.info: Turnout in % by province and community, 2015 (chart)The monitoring site lets you click any province on the province chart and see the same two bars for each of its towns and villages. Below are all 11 of these charts in English, one per province, each with the communities that stand out.
Three things repeat in almost every province:
- The towns, where observers and journalists are most present, have turnout of 33–55% and YES well below half of all voters.
- A group of villages reports turnout of 80–100%, sometimes higher than seems possible for places where many people work abroad.
- Where turnout is higher, the YES share of participants is higher too. In 10 of the 11 provinces the correlation is between 0.44 and 0.72.
Yerevan
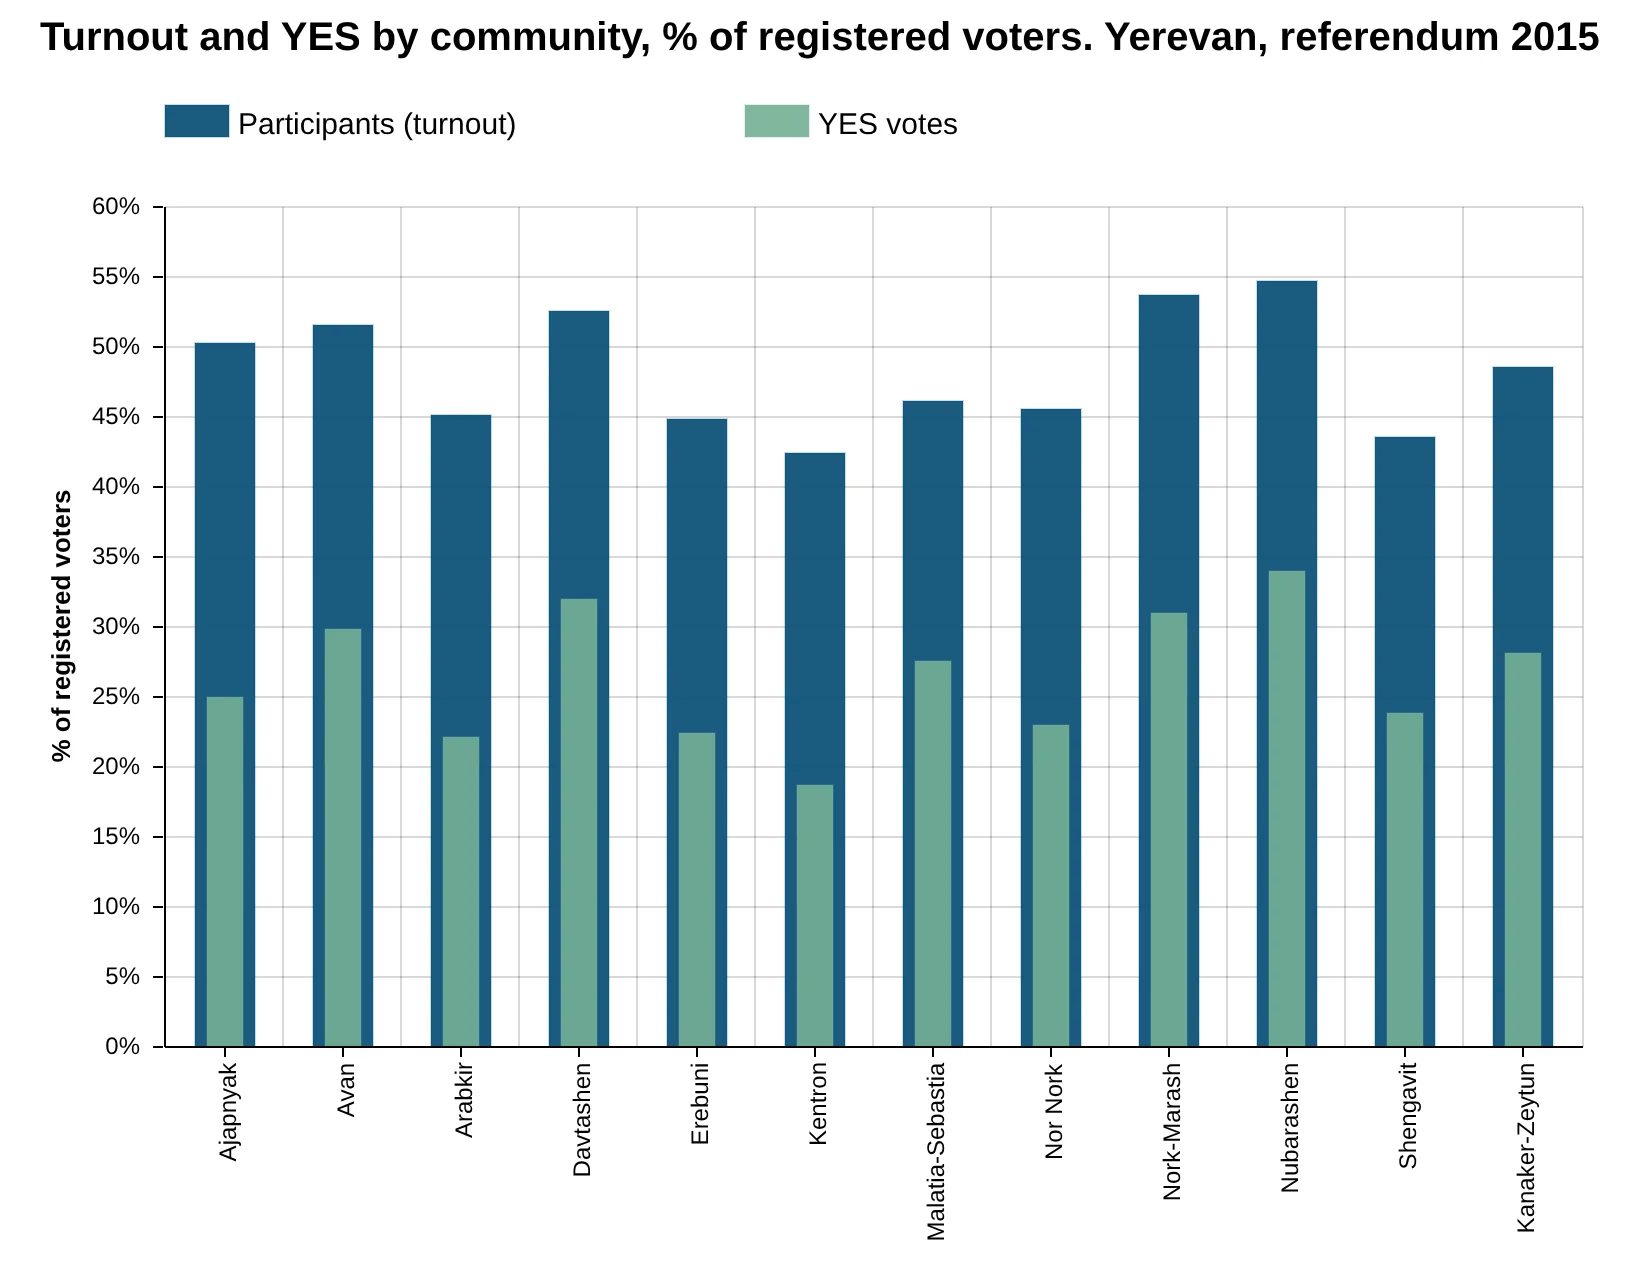
How to read this chart
12 districts, towns first and then villages in alphabetical order. Dark blue = turnout, green = YES, both as a share of the community's registered voters.
Turnout here ranges from 42.50% to 54.69%; 0 communities pass 80%.
What it shows
Yerevan has no villages, so the chart shows its 12 districts. Turnout stays in a narrow band from 42.50% (Kentron) to 54.69% (Nubarashen). Even here the districts with more turnout gave a larger YES share: Kentron, the lowest, had YES at 44% of participants, Nubarashen 62%.
Aragatsotn
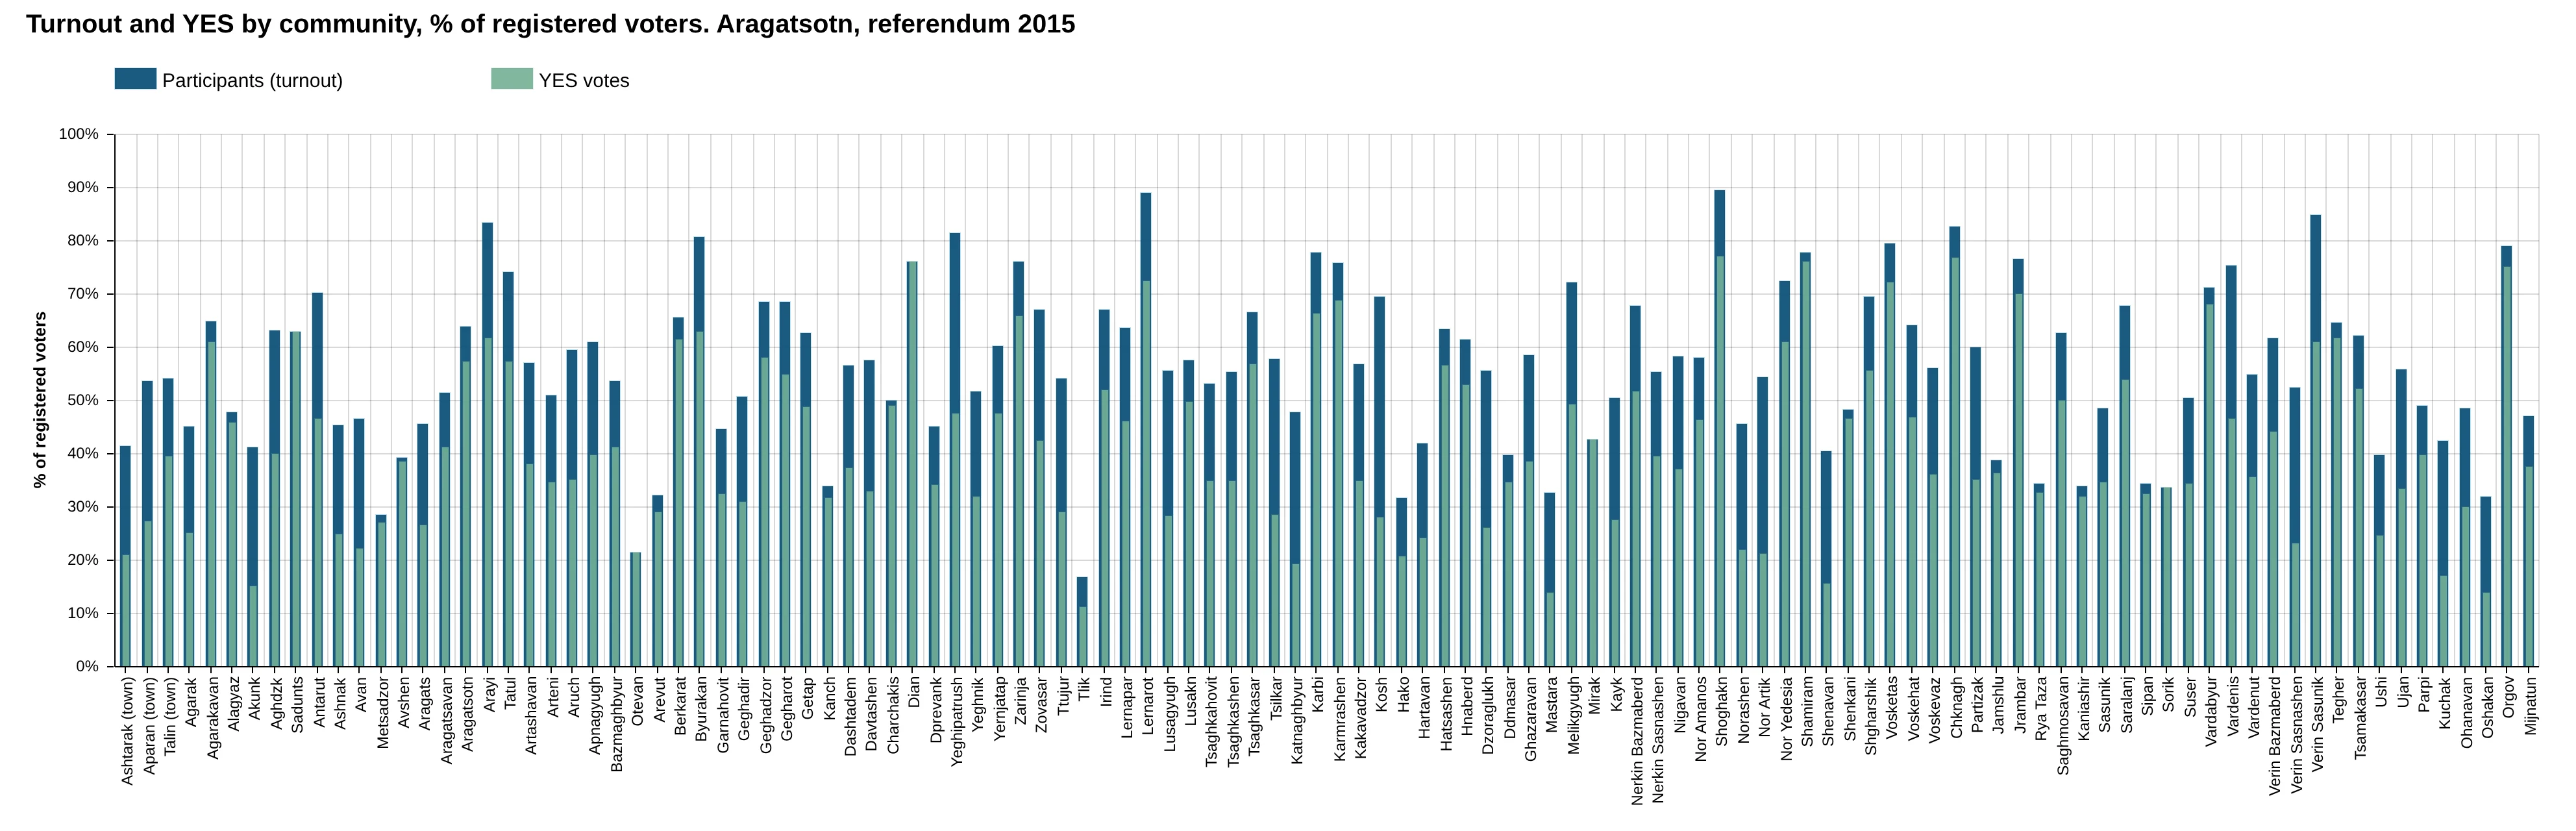
How to read this chart
114 communities, towns first and then villages in alphabetical order. Dark blue = turnout, green = YES, both as a share of the community's registered voters.
Turnout here ranges from 16.94% to 89.47%; 7 communities pass 80%.
What it shows
Turnout ranges very widely, from 16.94% in Tlik to 89.47% in Shoghakn. The provincial towns Ashtarak (41.52%) and Aparan (53.63%) are in the middle of the range, while several small villages report 80% and more with YES at 70–90% of participants.
Ararat
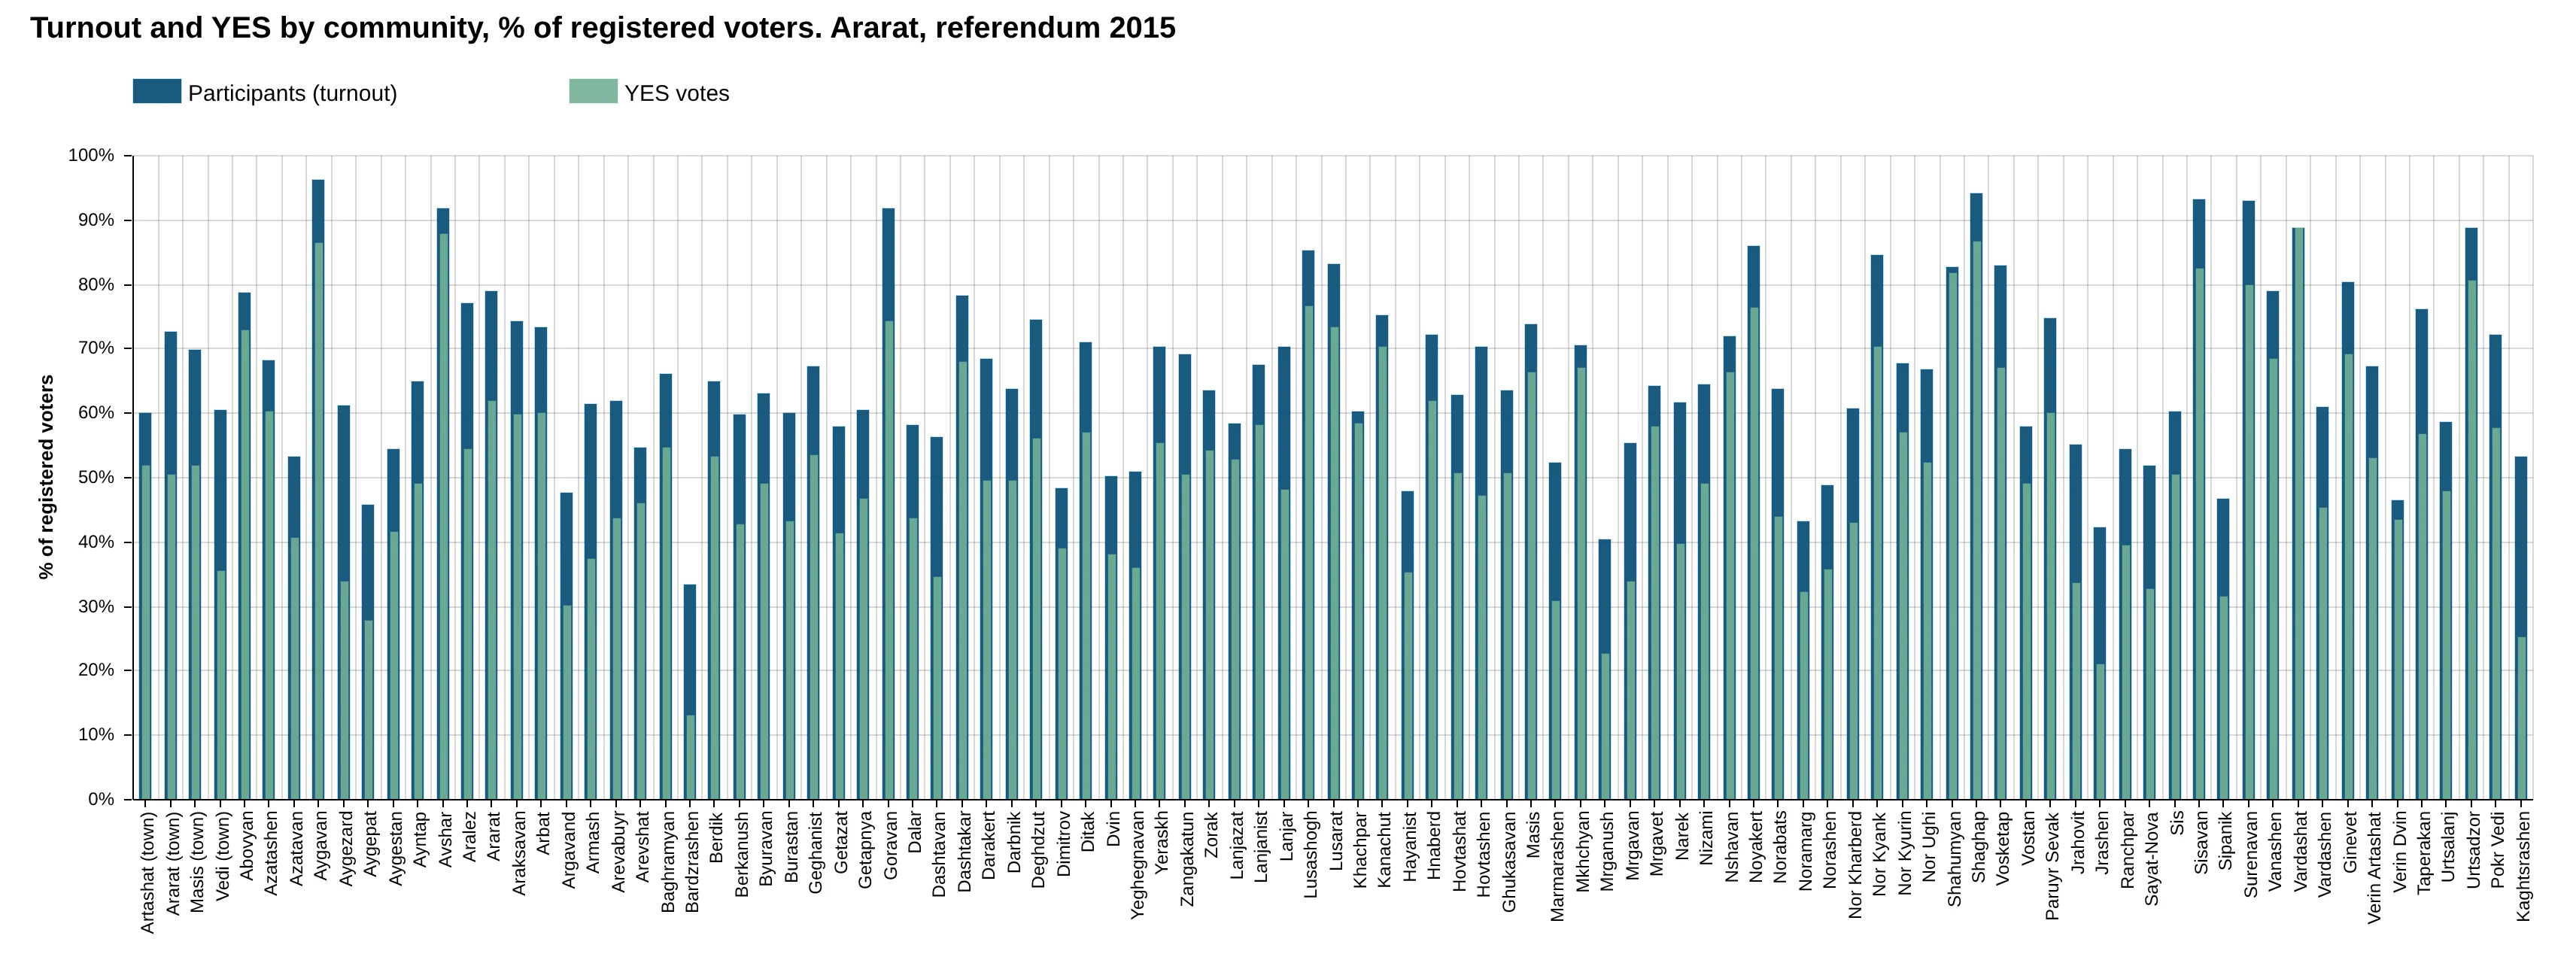
How to read this chart
97 communities, towns first and then villages in alphabetical order. Dark blue = turnout, green = YES, both as a share of the community's registered voters.
Turnout here ranges from 33.33% to 96.32%; 15 communities pass 80%.
What it shows
The province with the most extreme numbers: 15 communities report turnout of 80% or more and 6 report more than 90%: Aygavan 96.32%, Shaghap 94.13%, Sisavan 93.31%, Surenavan 92.91%, Avshar 91.81% and Goravan 91.71%. In Avshar 95.7% of participants voted YES. Within the province, communities with higher turnout gave higher YES (correlation 0.63).
Armavir
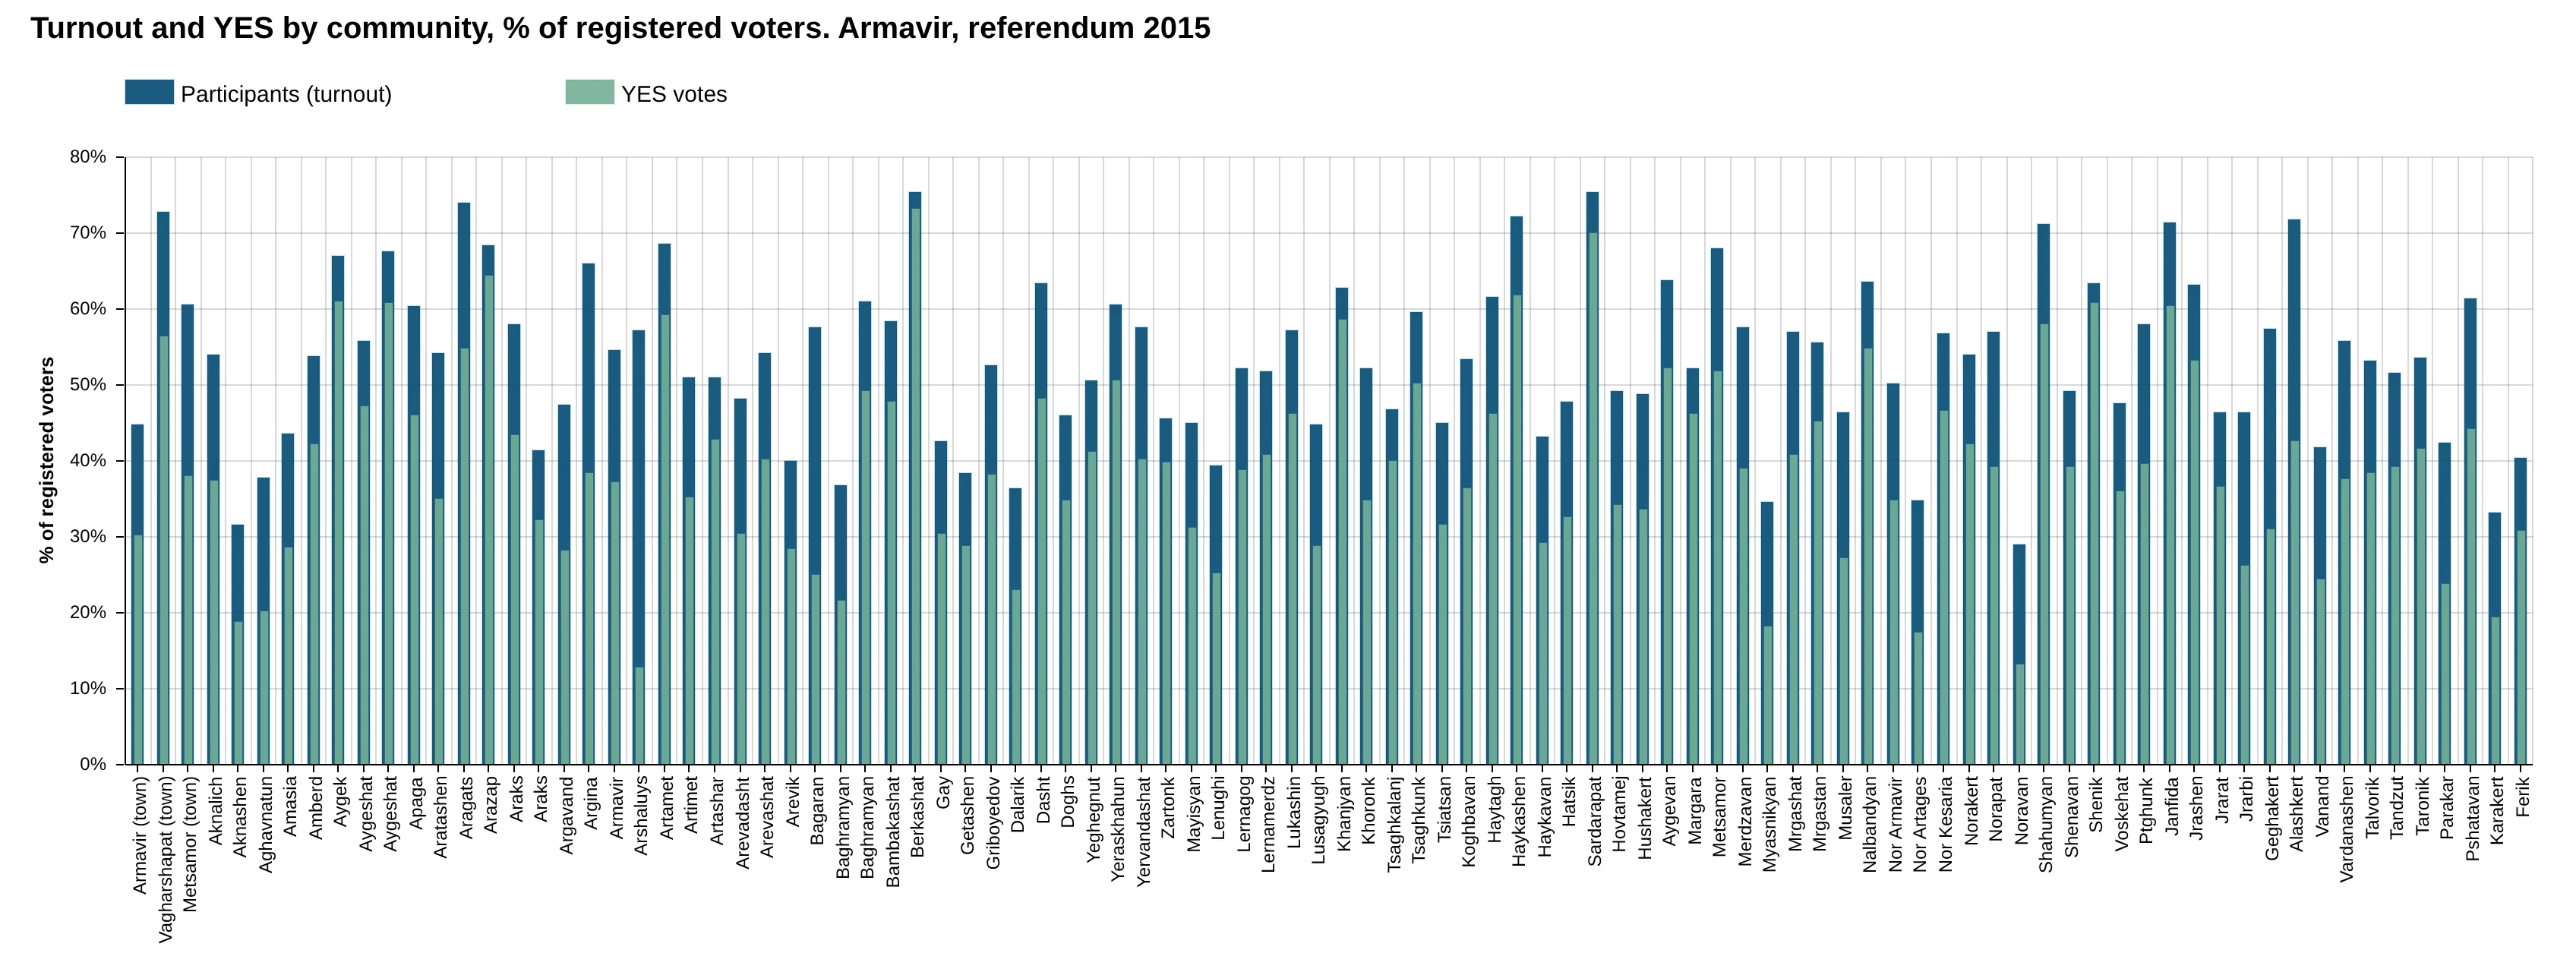
How to read this chart
96 communities, towns first and then villages in alphabetical order. Dark blue = turnout, green = YES, both as a share of the community's registered voters.
Turnout here ranges from 29.06% to 75.43%; 0 communities pass 80%.
What it shows
No community passes 80%, but the highest group is clear: Sardarapat 75.43% and Berkashat 75.35% (YES 97.2% of participants), and Vagharshapat (Etchmiadzin), the province's largest town, at 72.88% against 44.72% in the town of Armavir.
Gegharkunik
How to read this chart
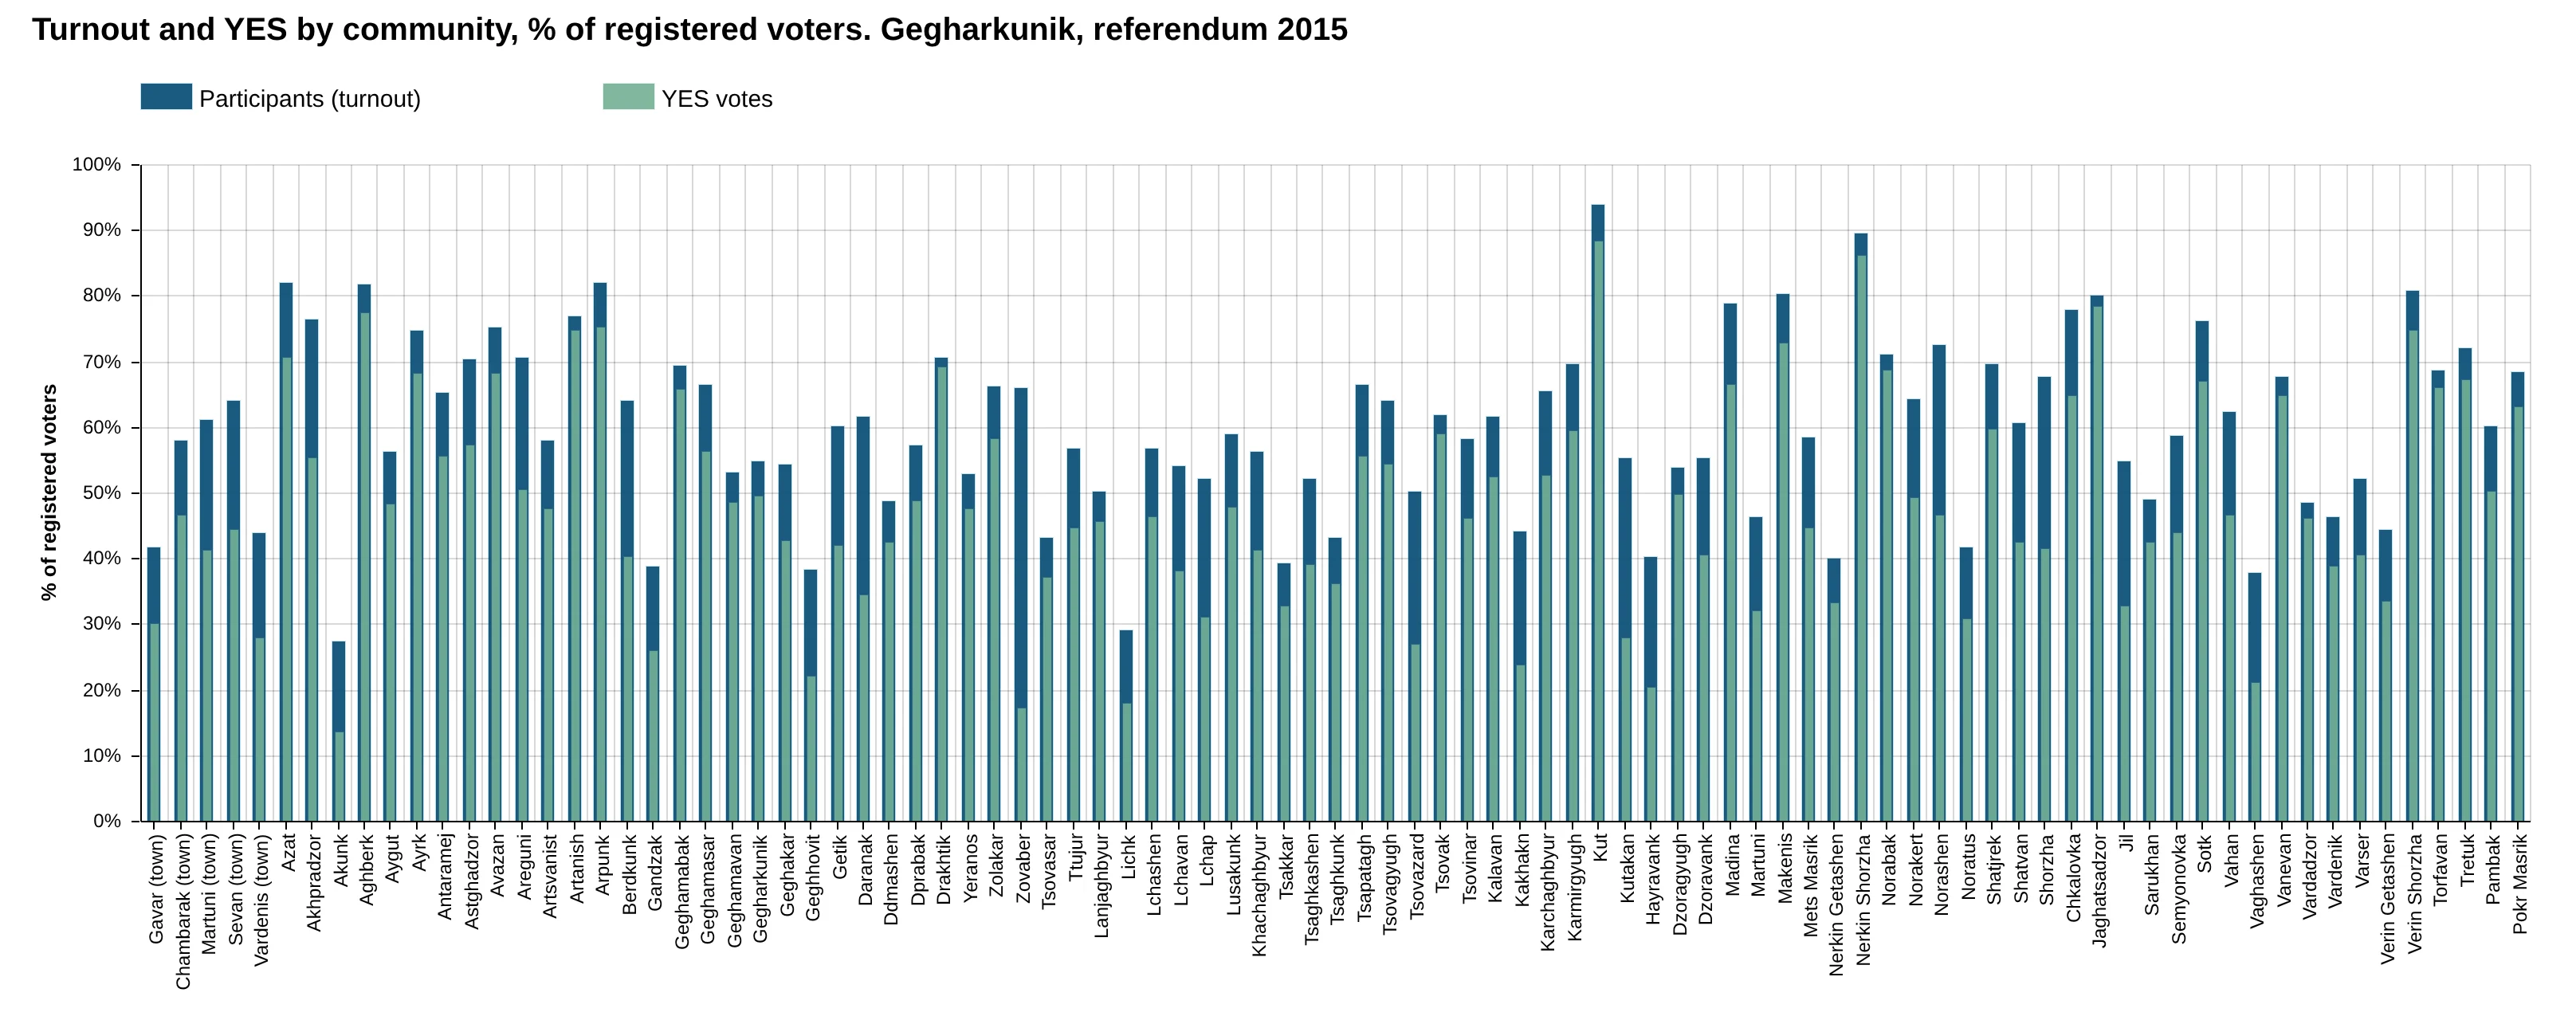
91 communities, towns first and then villages in alphabetical order. Dark blue = turnout, green = YES, both as a share of the community's registered voters.
Turnout here ranges from 27.33% to 93.90%; 8 communities pass 80%.
What it shows
Kut reports 93.90% turnout with 94% of participants voting YES, and Nerkin Shorzha 89.66% with 96%. The provincial capital Gavar has only 41.66%. Eight communities pass 80%.
Lori
How to read this chart
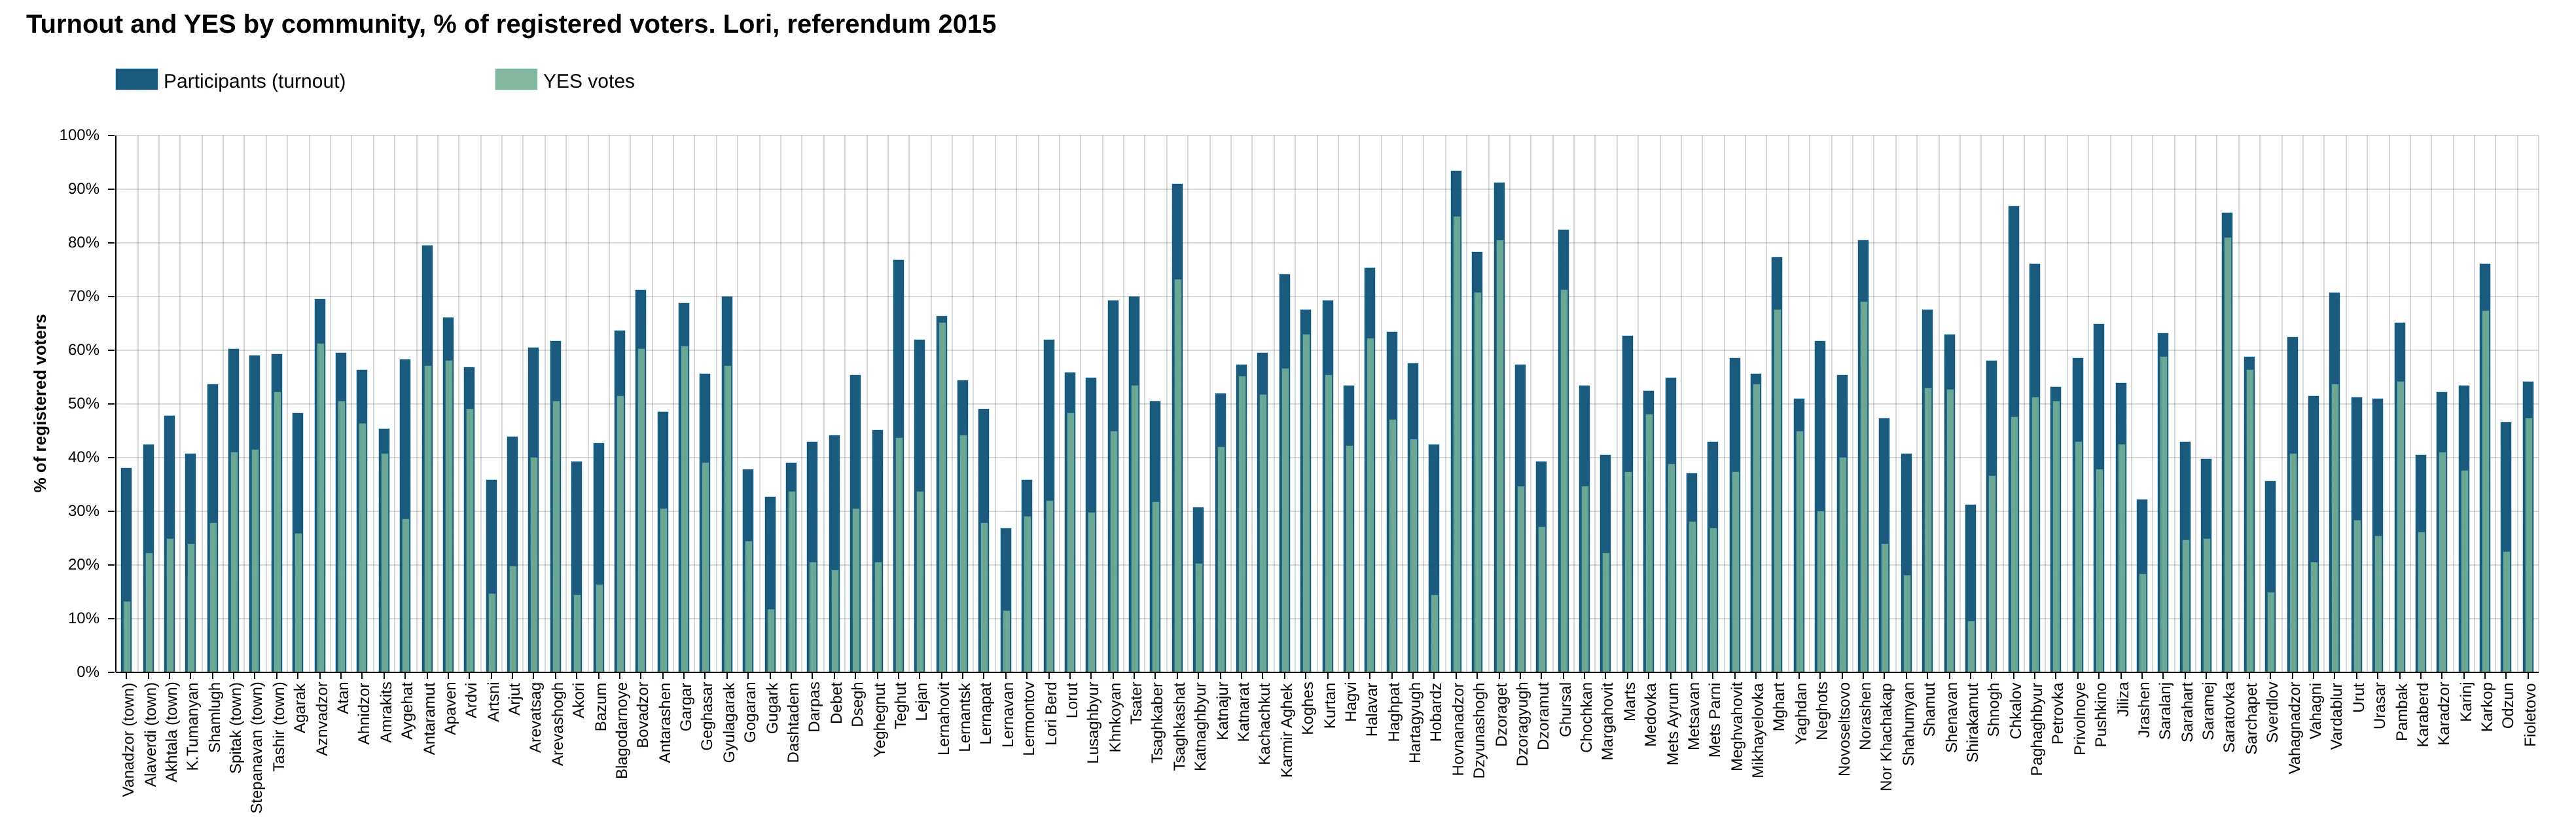
113 communities, towns first and then villages in alphabetical order. Dark blue = turnout, green = YES, both as a share of the community's registered voters.
Turnout here ranges from 26.89% to 93.48%; 7 communities pass 80%.
What it shows
Vanadzor, Armenia's third largest city, had turnout of 38.04% and YES from only 13.12% of its voters. In the same province, Hovnanadzor (93.48%), Dzoraget (91.12%) and Tsaghkashat (91.08%) report more than 90%.
Kotayk
How to read this chart
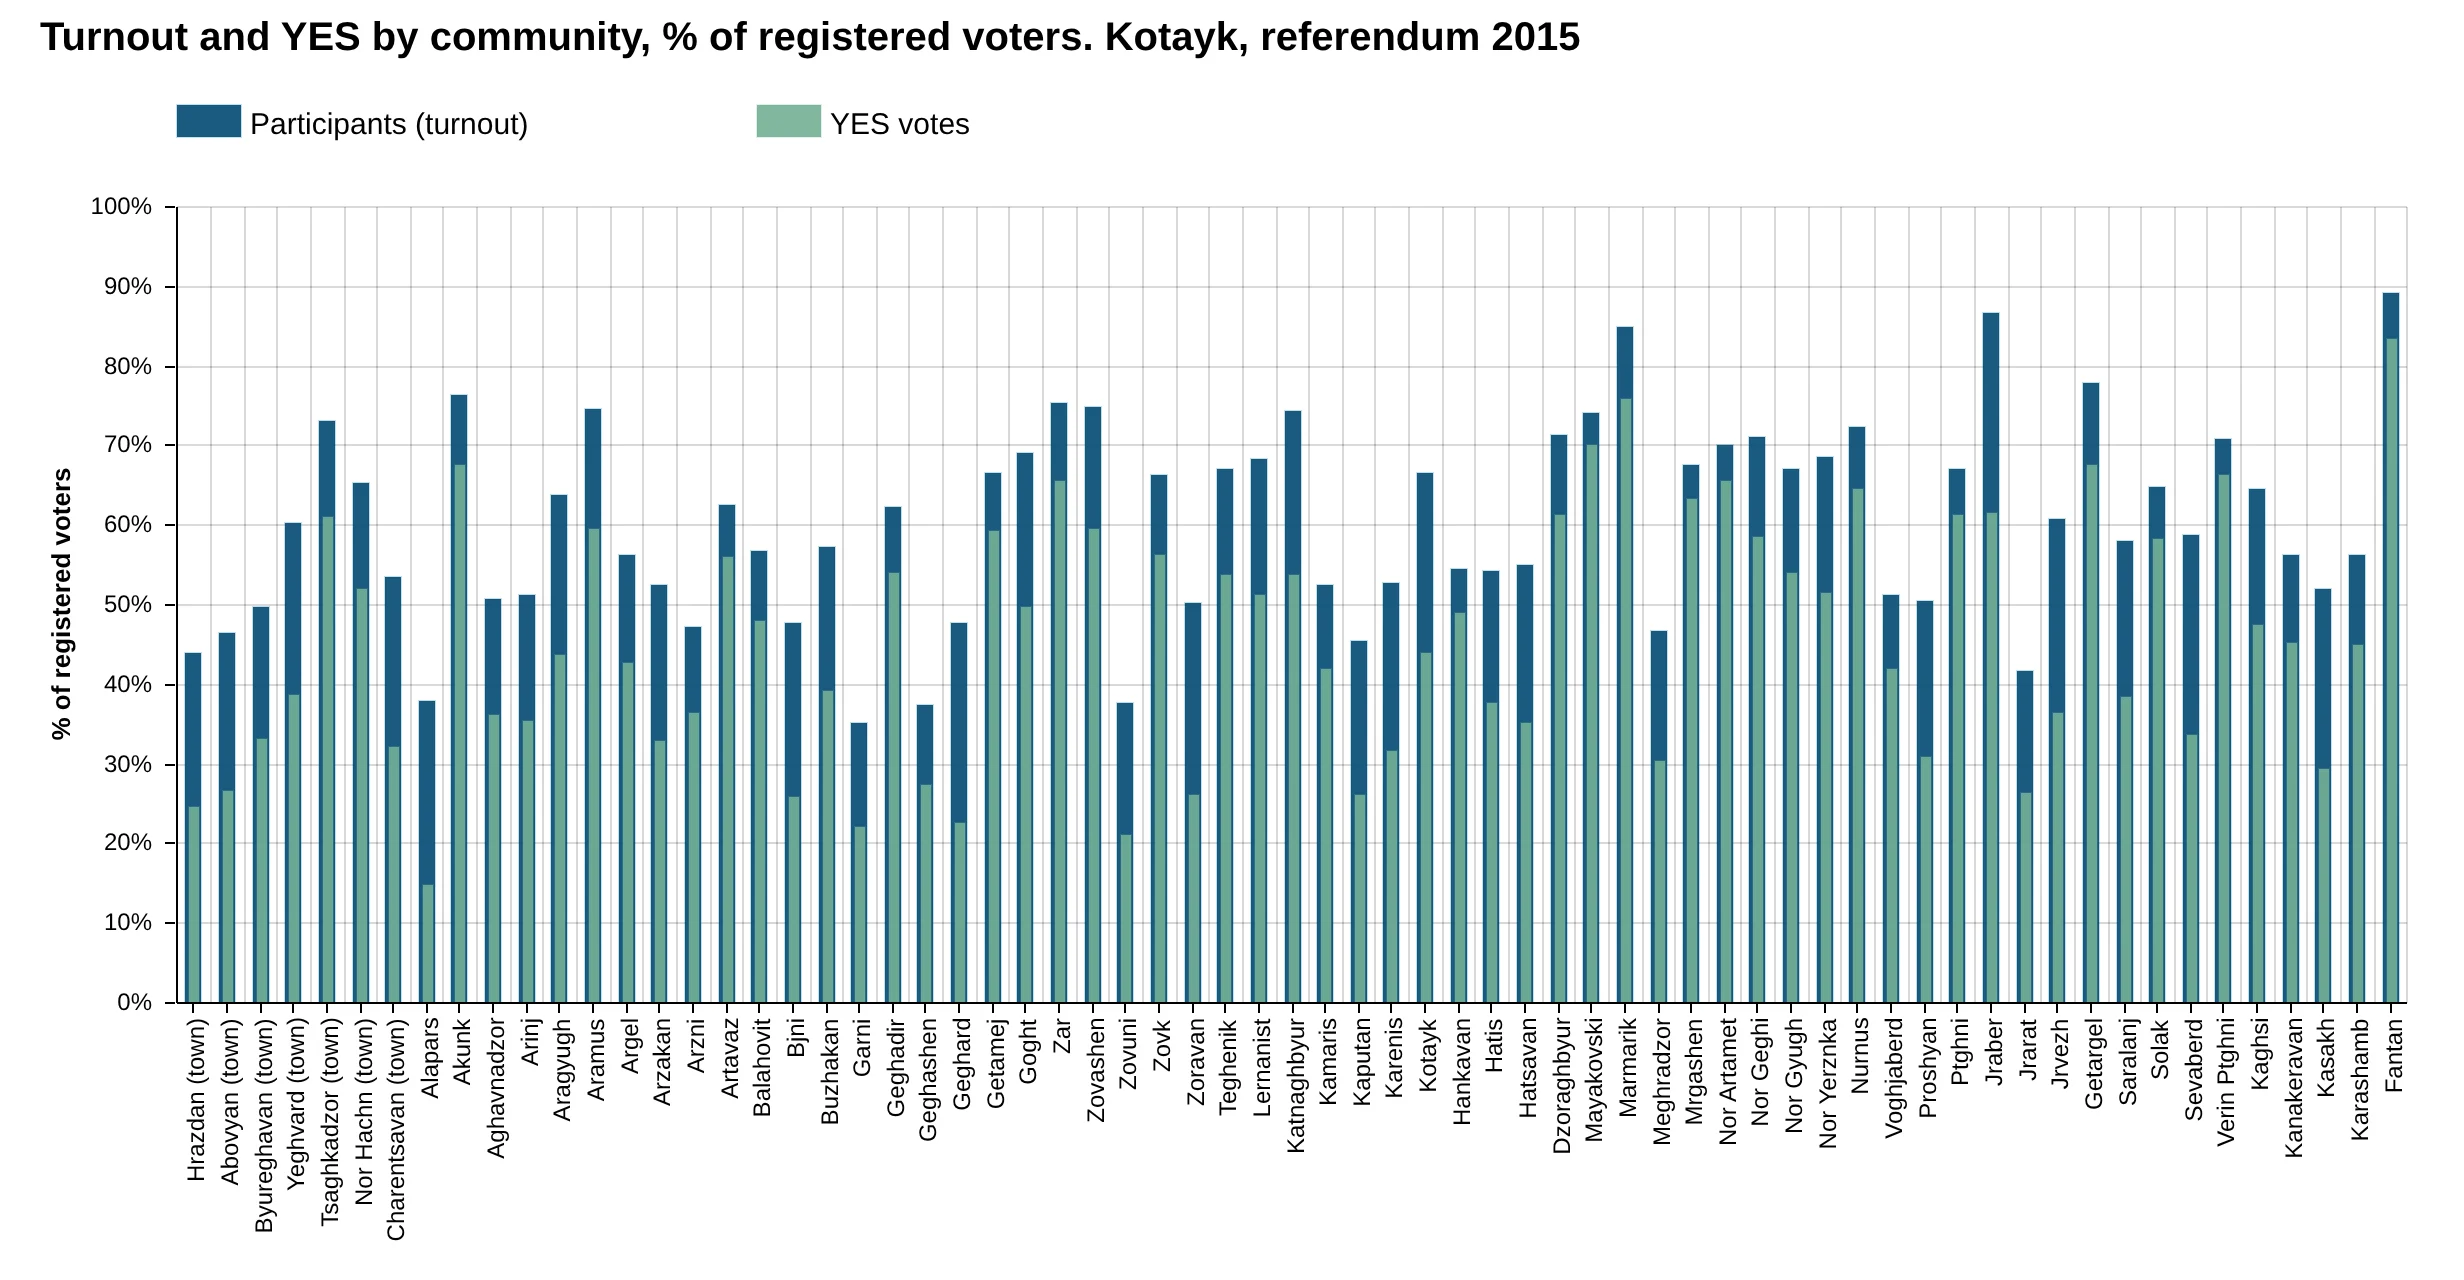
67 communities, towns first and then villages in alphabetical order. Dark blue = turnout, green = YES, both as a share of the community's registered voters.
Turnout here ranges from 35.28% to 89.21%; 3 communities pass 80%.
What it shows
The towns of Hrazdan (43.95%) and Abovyan (46.41%) are low, while Fantan reports 89.21% turnout with YES at 93.5% of participants. Kotayk has the strongest link between turnout and YES among the provinces (0.68) after Yerevan.
Shirak
How to read this chart
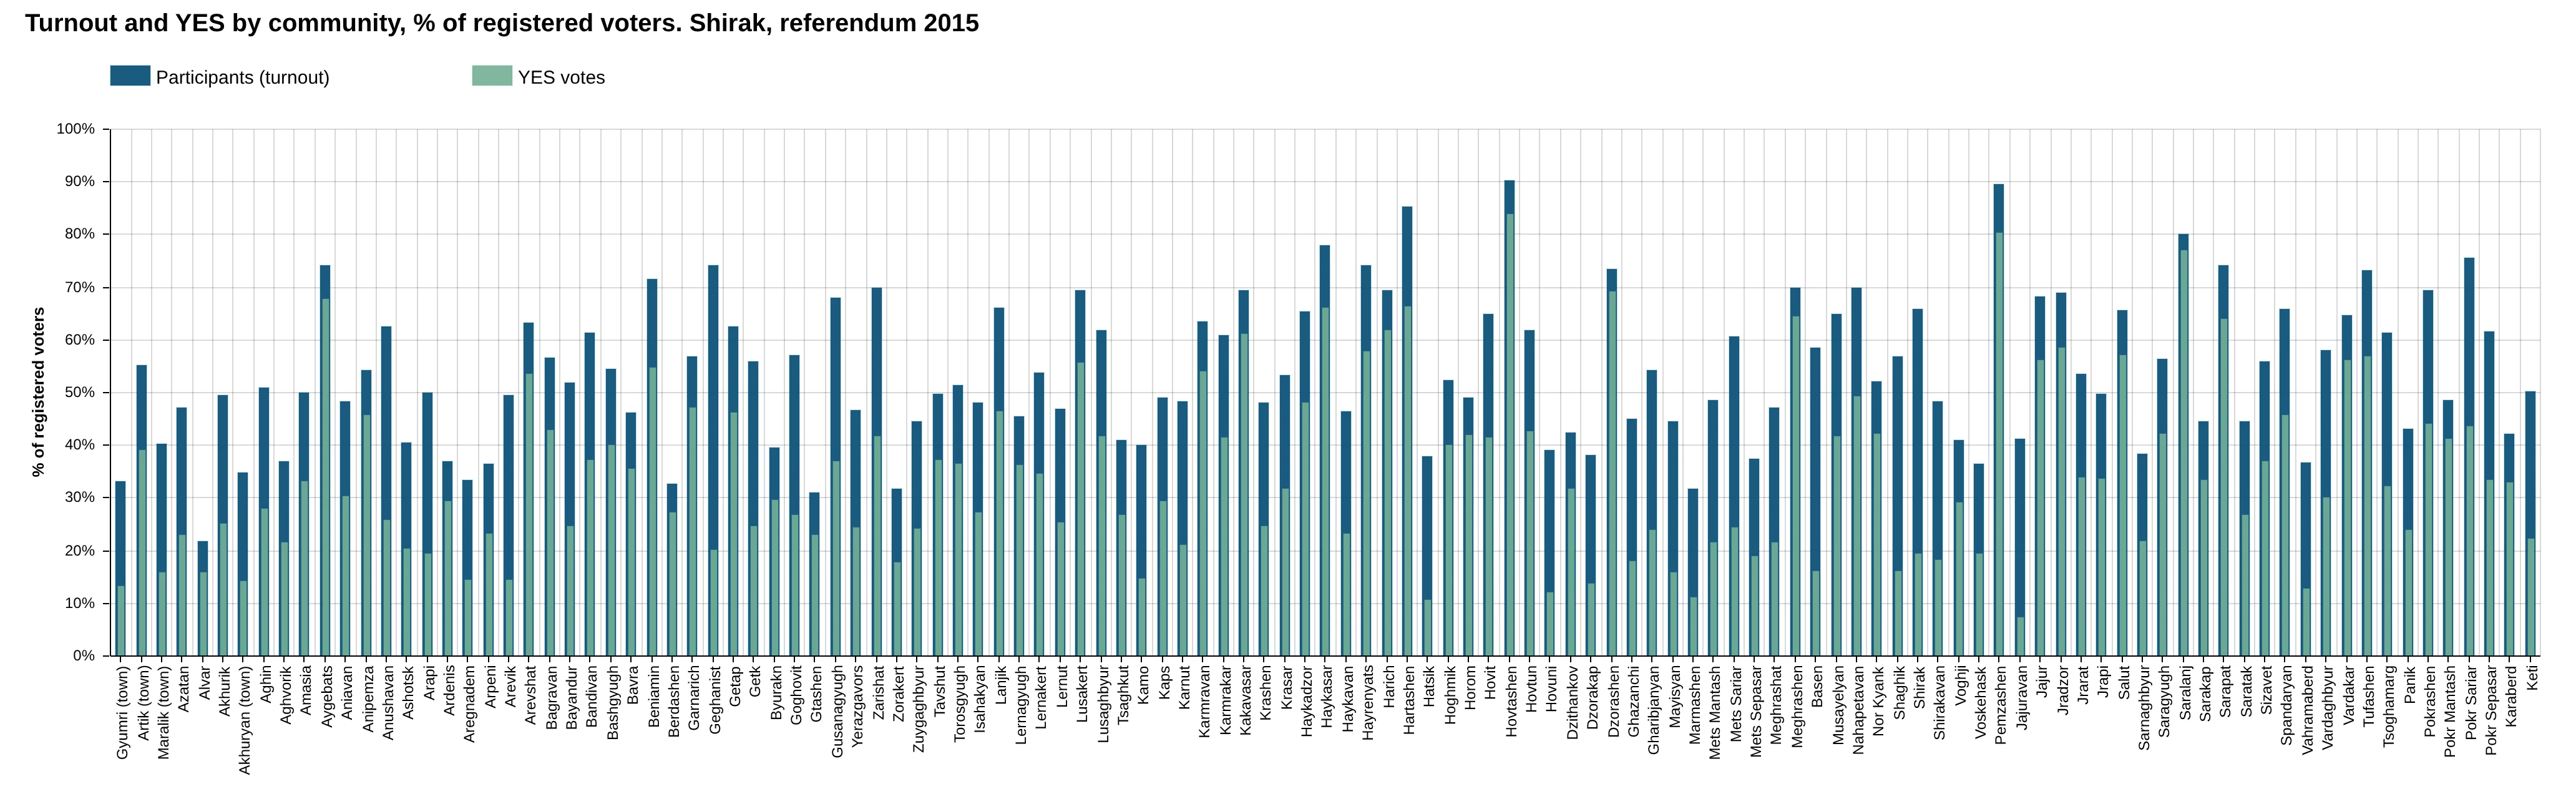
119 communities, towns first and then villages in alphabetical order. Dark blue = turnout, green = YES, both as a share of the community's registered voters.
Turnout here ranges from 21.72% to 90.38%; 4 communities pass 80%.
What it shows
Gyumri, Armenia's second largest city, had turnout of 33.08%, and YES from 13.29% of its voters. Villages such as Hovtashen (90.38%) and Pemzashen (89.46%) report three times that turnout, with YES at about 90% of participants.
Syunik
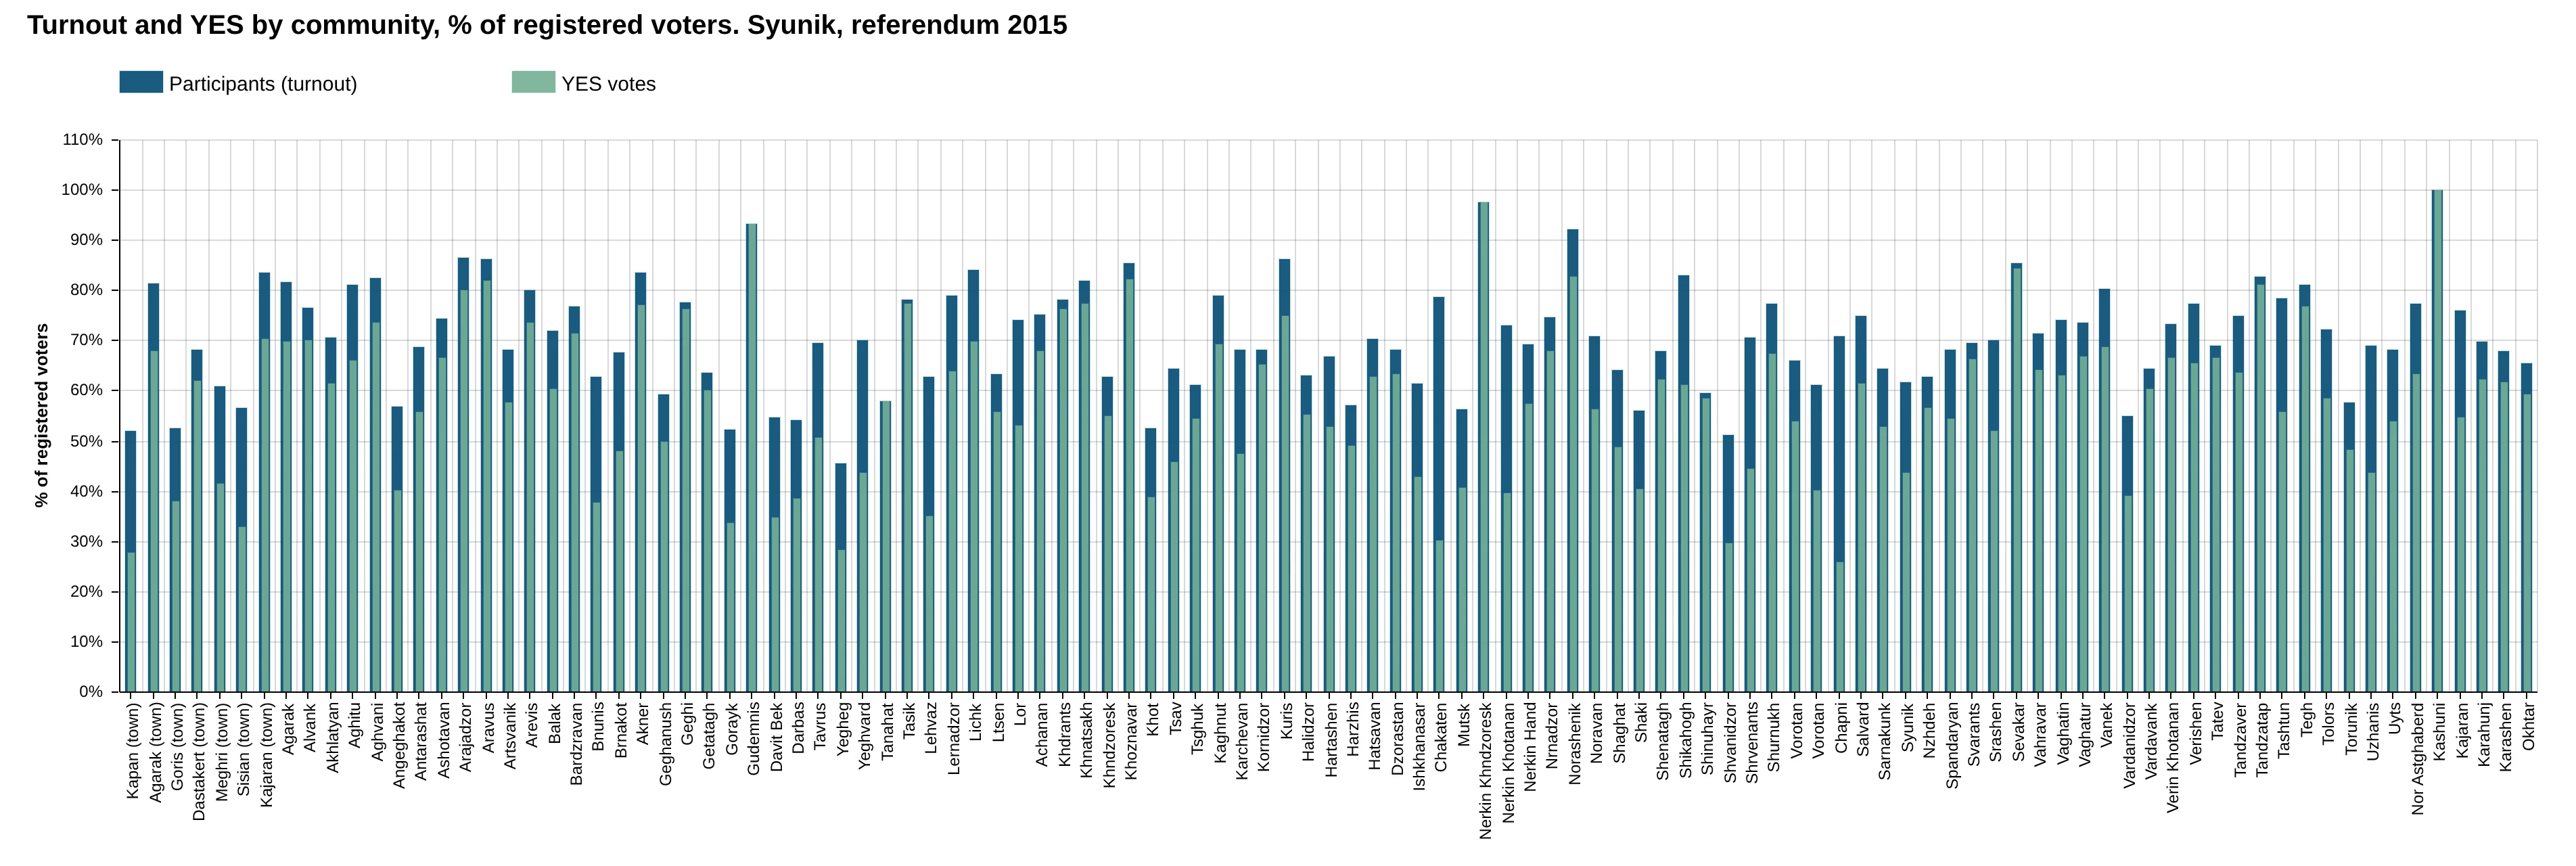
How to read this chart
109 communities, towns first and then villages in alphabetical order. Dark blue = turnout, green = YES, both as a share of the community's registered voters.
Turnout here ranges from 45.45% to 100.00%; 22 communities pass 80%.
What it shows
The province with the highest turnout overall: 22 of 109 communities pass 80%. Kashuni reports 100% turnout and 100% YES, Nerkin Khndzoresk 97.63% with YES from 97.51% of all voters, Gudemnis 93.33% with no NO votes at all. The mining towns Kajaran (83.66%) and Agarak (81.37%) are far above Kapan (52.16%).
Vayots Dzor
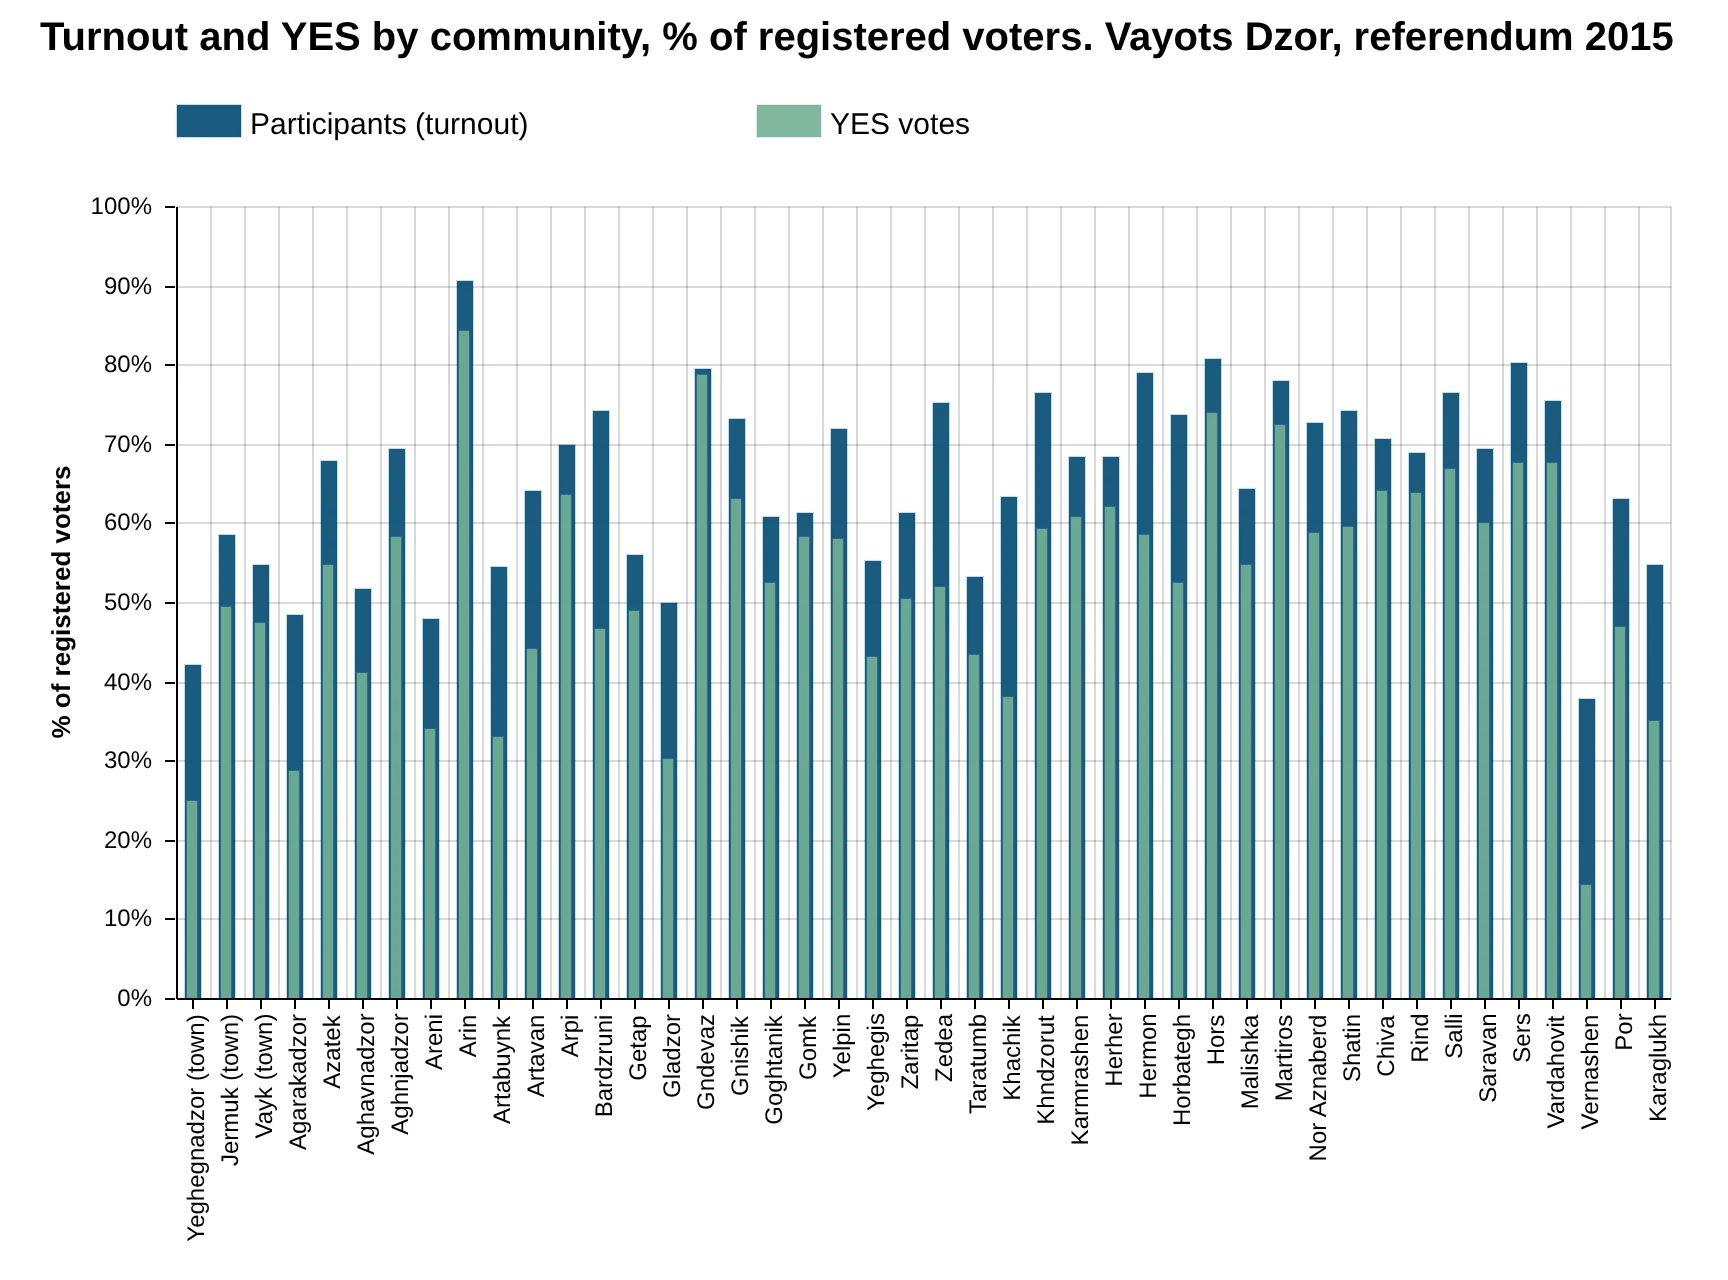
How to read this chart
44 communities, towns first and then villages in alphabetical order. Dark blue = turnout, green = YES, both as a share of the community's registered voters.
Turnout here ranges from 37.93% to 90.65%; 3 communities pass 80%.
What it shows
Arin reports 90.65% turnout, Gndevaz 79.53% with YES at 99.2% of participants. The provincial capital Yeghegnadzor has only 42.16%.
Tavush
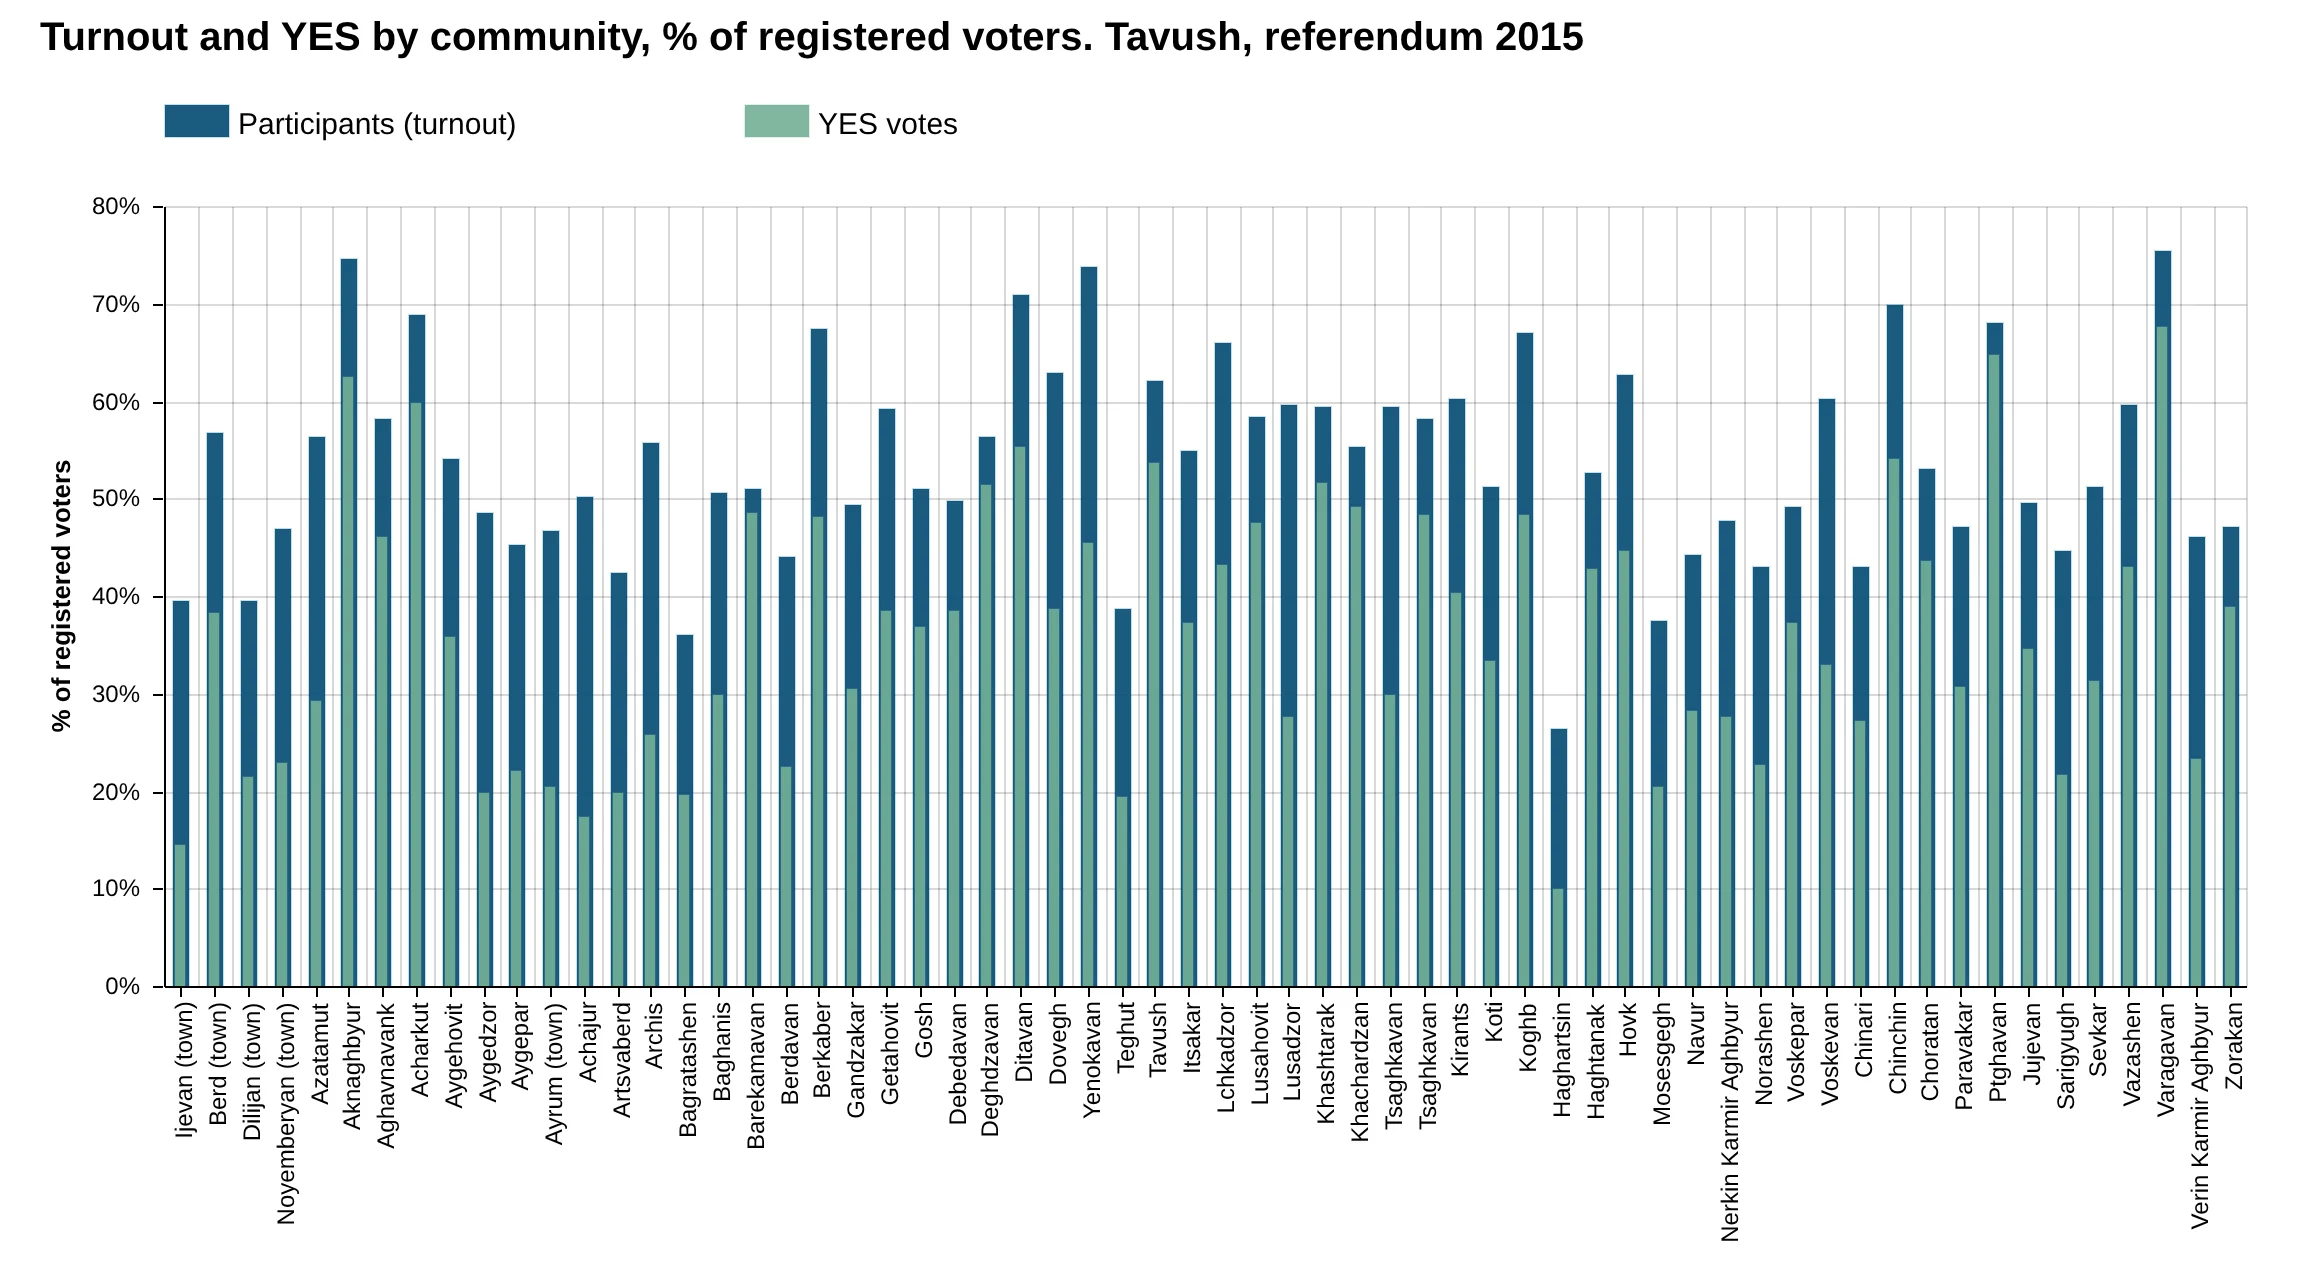
How to read this chart
62 communities, towns first and then villages in alphabetical order. Dark blue = turnout, green = YES, both as a share of the community's registered voters.
Turnout here ranges from 26.43% to 75.58%; 0 communities pass 80%.
What it shows
Tavush has no community above 80%. The towns Ijevan (39.61%) and Dilijan (39.69%) are low; the highest are border villages like Varagavan (75.58%) and Aknaghbyur (74.75%).
What the community charts add
The province totals already showed that high turnout went with high YES. The community charts show where that turnout came from: not from the cities, but from a limited number of villages and small towns. In 2015 the charts cover 924 communities and Yerevan districts; 69 of them reported turnout of 80% or more. Those places are where a check of signatures, envelopes and voting speed at each polling station matters most. See how polling station capacity is checked.
Data and sources on this site
From the book
This article is based on Chapter VI of Electoral Rights and Election Falsification by Lyudvig Khachatryan, which explains the full method, the formulas and the cases behind it.