Armenia 2008 Presidential Election: Results Without the Suspect Polling Stations
Officially the winner had 51.6% of participants. At polling stations without mismatches and with possible turnout, he had 45.7%, short of a first-round win.
Original page on electionscount.info: The Electoral Rights and Falsifications of Elections (2010, PDF), p. 61A candidate needed more than half of the votes to win the 2008 presidential election in the first round. The book takes the official results and recalculates them for different groups of polling stations.
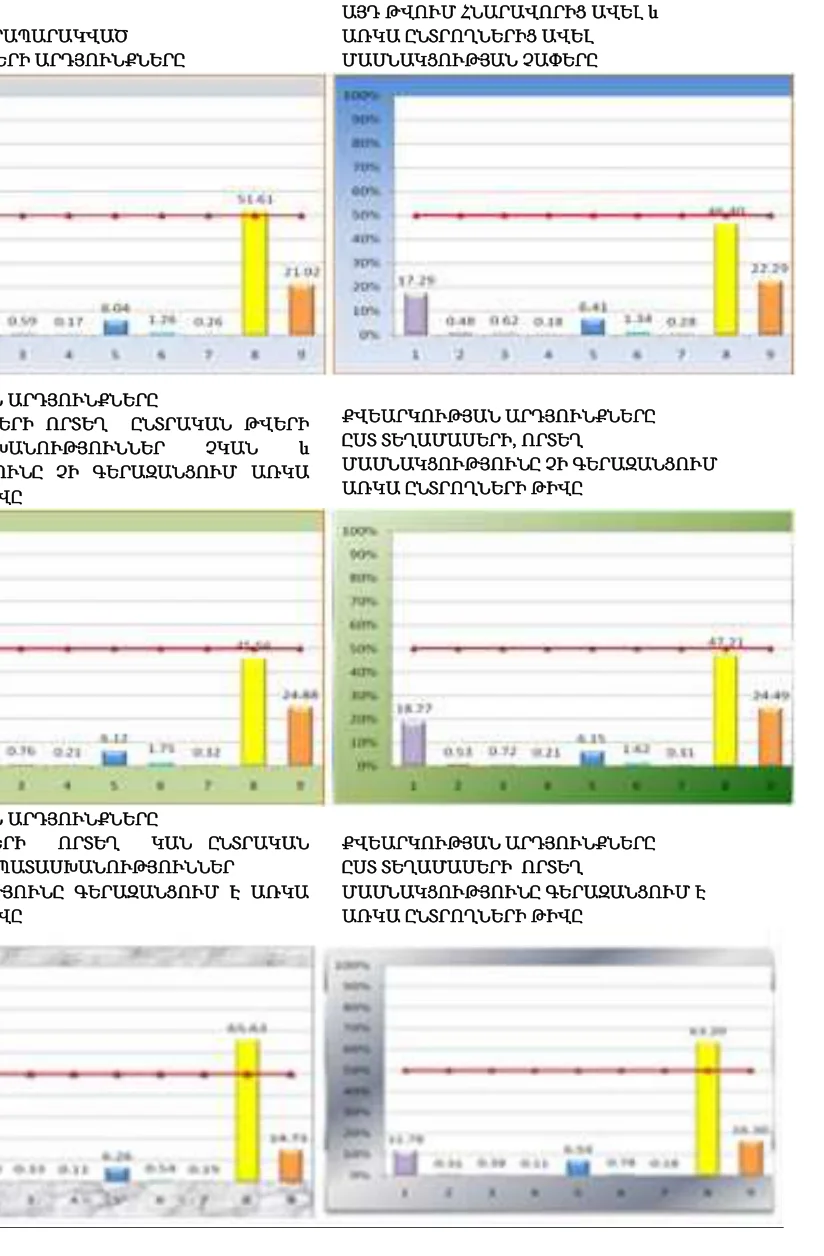
How to read this chart
Each chart shows the nine candidates as % of participants, with a red line at 50%. Candidate 8 is Serzh Sargsyan (yellow), 9 Levon Ter-Petrosyan (orange), 1 Artur Baghdasaryan (purple), 5 Vahan Hovhannisyan (blue).
- Top left: official results. Top right: all stations, deducting the mismatches, including impossible turnout and turnout above available voters.
- Middle left: stations without mismatches and with turnout not above available voters. Middle right: stations where turnout does not exceed the available voters.
- Bottom left: stations with mismatches and turnout above available voters. Bottom right: stations where turnout exceeds the available voters.
What it shows
Only in the official result and in the two suspect groups does the yellow bar cross the 50% line.
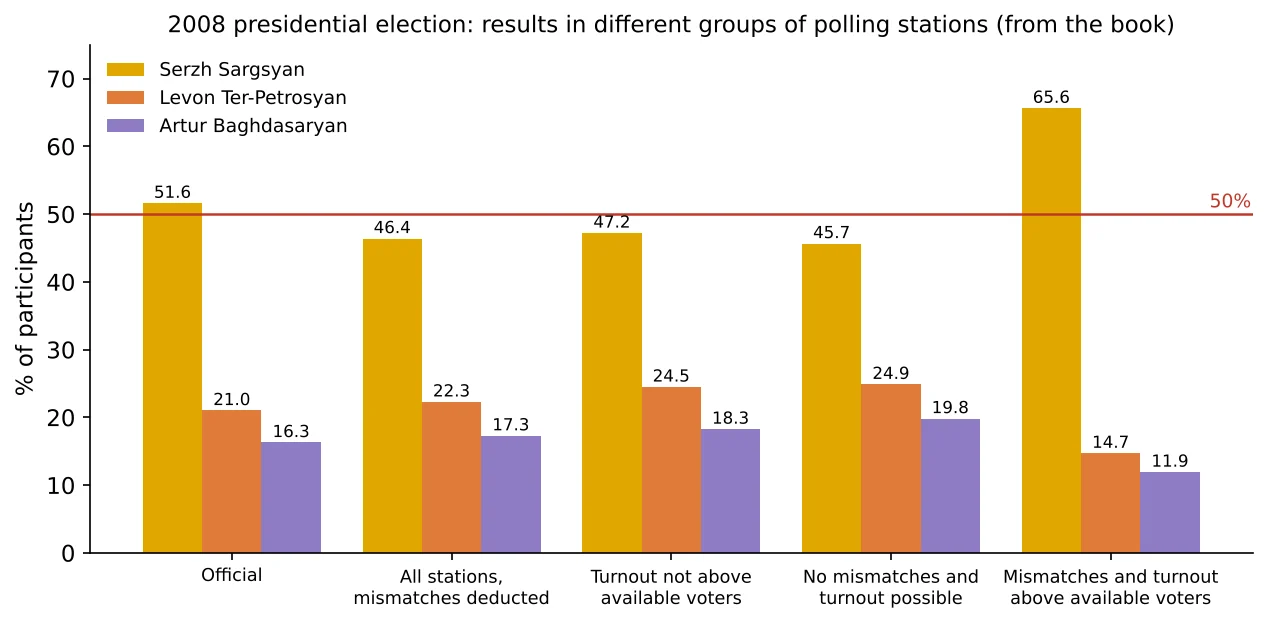
How to read this chart
Each group of bars is one calculation from the book; the red line is 50%.
What it shows
- Official: Sargsyan 51.61, Ter-Petrosyan 21.02, Baghdasaryan 16.30.
- All stations, mismatches deducted: 46.40, 22.29, 17.29.
- Turnout not above available voters: 47.21, 24.49, 18.27.
- No mismatches and possible turnout: 45.66, 24.88, 19.83.
- Mismatches and turnout above available voters: 65.63, 14.71, 11.93.
Wherever the numbers are clean, the leading candidate stays below 50% and a second round would have been required.
Mismatches and stuffing
- Mismatches at 637 stations; the smallest possible total, taking one maximum error per station, is 10,988. Officially recorded: 6,720.
- Officially recorded stuffing (ballots above participants): 1,563 at 156 stations, e.g. 153 at Gyumri 34/26, 93 at Aygedzor 41/28, 80 at Malatia-Sebastia 7/21, 62 at Erebuni 13/7, 55 at Ajapnyak 9/31.
- All falsifications together, including participation above the voters present in each community, exceed 100,000: 4.3% of all voters.
For comparison, the same method applied to the 2013 presidential election: 2013 precincts with and without observers.
Source: “The Electoral Rights and Falsifications of Elections” (2010, in Armenian), the earlier Armenian book by the same author, which analyses the officially published figures of each election. The figures here are taken from it; page numbers refer to the PDF.
Data and sources on this site
From the book
This article is based on the 2010 Armenian edition of Electoral Rights and Election Falsification by Lyudvig Khachatryan, which explains the full method, the formulas and the cases behind it.