Armenia 2007: Parliament Seats From Clean and From Suspect Polling Stations
In polling stations without mismatches or impossible turnout the Republican Party had 24%; in the others, 50%. Of the 90 party-list seats, 38 came from the suspect results.
Original page on electionscount.info: The Electoral Rights and Falsifications of Elections (2010, PDF), p. 60The book divides the 1,923 stations into two groups: those with mismatches between electoral numbers or with turnout above what was possible, and those without. It then calculates each party’s share in each group, and the seats each group would produce.
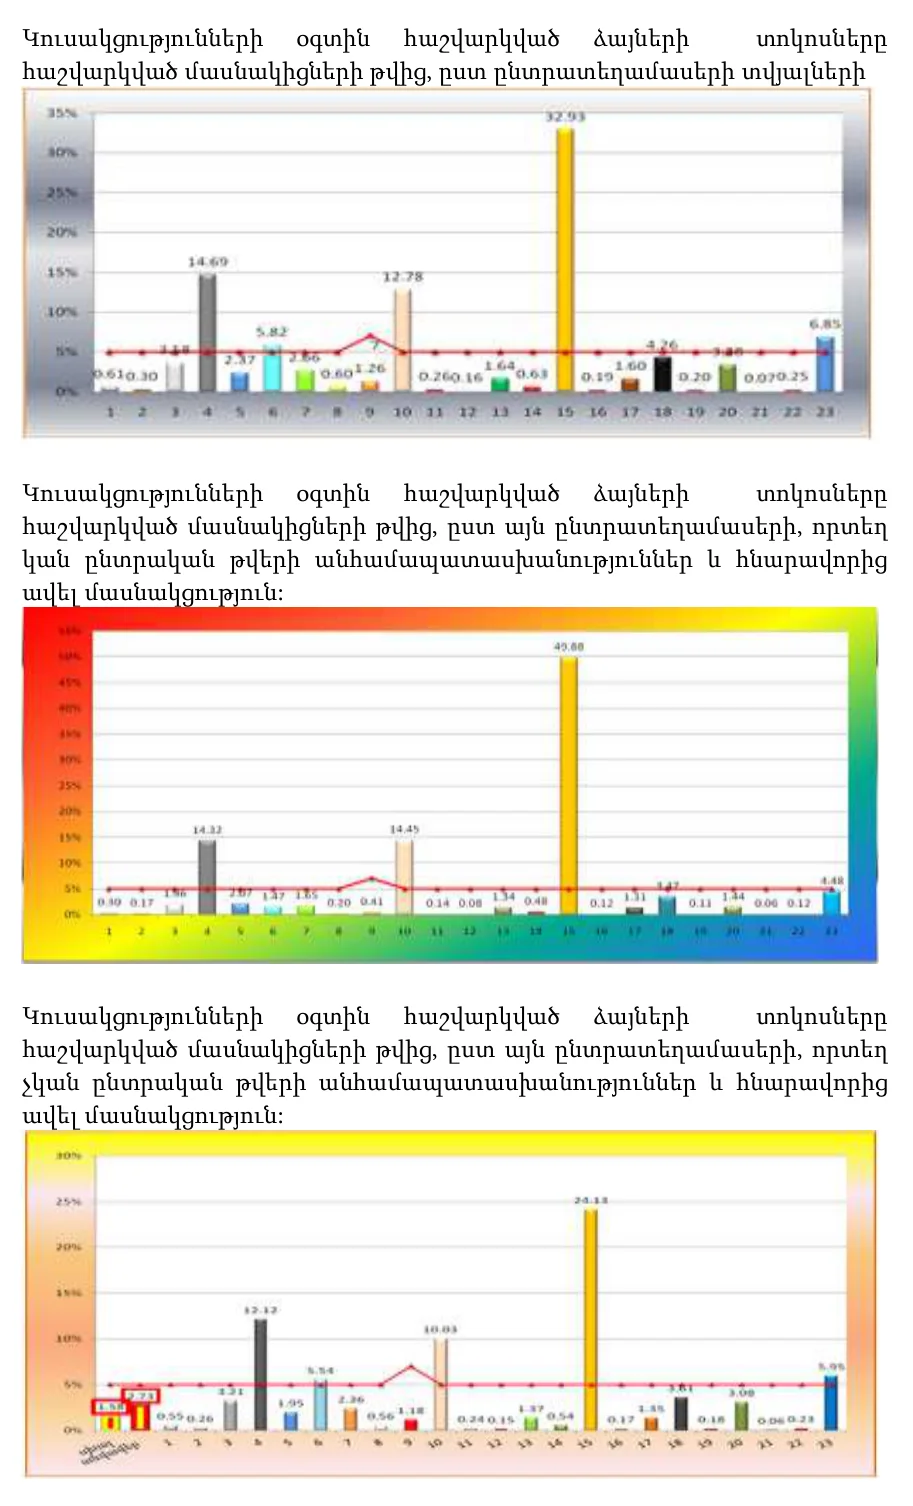
How to read this chart
Top: shares of the 23 lists among participants at all stations. Middle: at stations with mismatches or turnout above what was possible. Bottom: at stations without them. The red line is the 5% threshold (7% for the alliance, list 9). Numbering: 15 Republican Party, 4 Prosperous Armenia, 10 ARF, 23 Rule of Law, 6 Heritage.
What it shows
The yellow bar of the Republican Party is 32.93% overall, 49.88% in the suspect stations and 24.13% in the clean ones. In the clean stations several small lists come close to 5%.
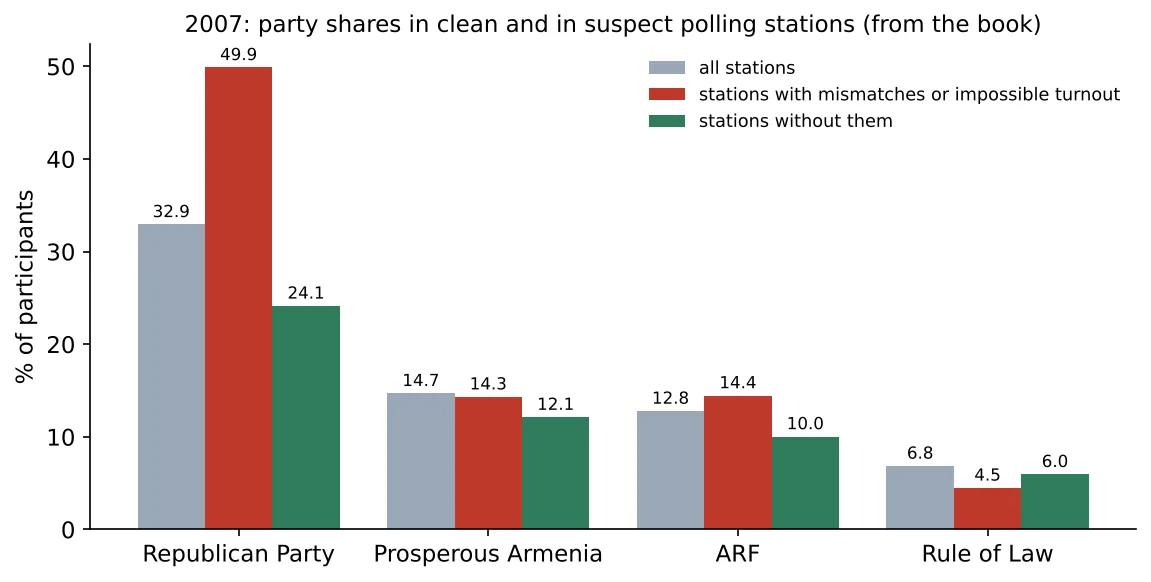
How to read this chart
For each list: grey all stations, red suspect stations, green clean stations; shares of participants.
What it shows
| List | All | Suspect | Clean |
|---|---|---|---|
| Republican Party | 32.93 | 49.88 | 24.13 |
| Prosperous Armenia | 14.69 | 14.32 | 12.12 |
| ARF | 12.78 | 14.45 | 10.03 |
| Rule of Law | 6.85 | 4.48 | 5.95 |
Only the ruling party doubles its share in the suspect stations; the others change little. The difference between the groups is the measure of what was added.
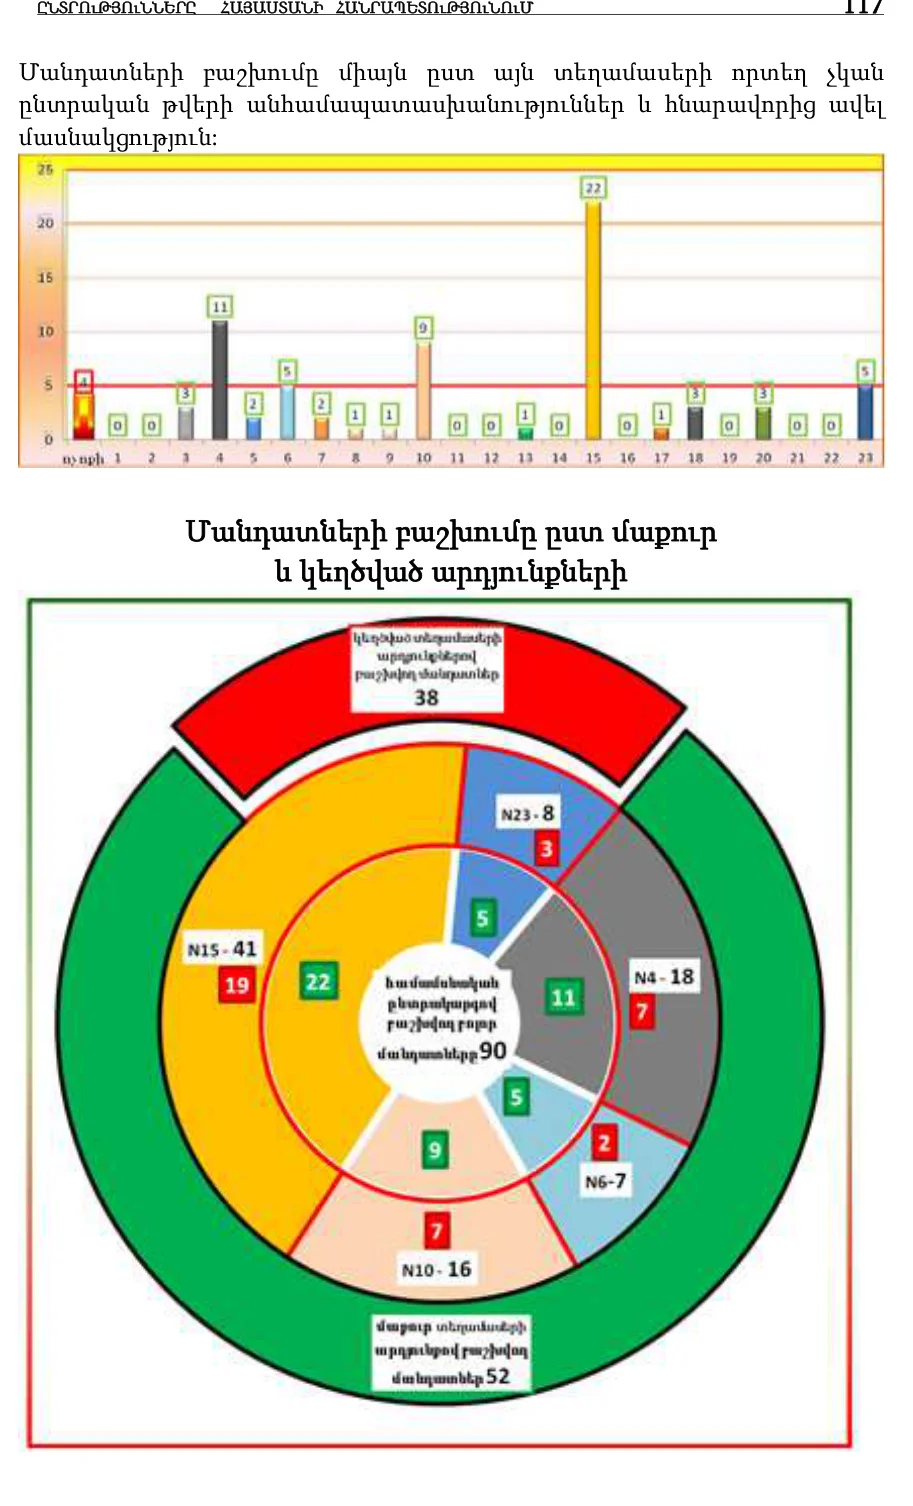
How to read this chart
The outer ring divides the 90 seats into those produced by clean results (green, 52) and by falsified results (red, 38). Inside, each party’s official seats are split: green numbers from clean, red from falsified results. The chart above it shows the seats from clean stations only.
What it shows
Republican Party 41 = 22 + 19; Prosperous Armenia 18 = 11 + 7; ARF 16 = 9 + 7; Rule of Law 8 = 5 + 3; Heritage 7 = 5 + 2.
Almost half of the Republican Party’s 41 seats, by this calculation, came from results that cannot be trusted.
Source: “The Electoral Rights and Falsifications of Elections” (2010, in Armenian), the earlier Armenian book by the same author, which analyses the officially published figures of each election. The figures here are taken from it; page numbers refer to the PDF.
Data and sources on this site
From the book
This article is based on the 2010 Armenian edition of Electoral Rights and Election Falsification by Lyudvig Khachatryan, which explains the full method, the formulas and the cases behind it.