Armenia 2007: How 14,665 Inaccuracies Could Change Who Entered Parliament
One party missed the 5% threshold by 9,033 votes; the commissions recorded 14,665 inaccuracies. An error of only 664 votes would have moved a seat.
Original page on electionscount.info: The Electoral Rights and Falsifications of Elections (2010, PDF), p. 55Under Article 115 of the Code, seats went to lists with at least 5% (parties) or 7% (alliances) of the sum of valid ballots and inaccuracies. Seats were then divided in proportion to votes, remainders one by one. The book shows that this way of “taking inaccuracies into account” is itself biased.
The 2007 numbers
- Recorded inaccuracies: 14,665.
- One more party would have passed 5% if those inaccuracies had come from its votes; it lacked 9,033 votes.
- The smallest arithmetic error that changes the seat allocation: 664. A seat distributed by remainders would have gone to the next party if its votes were higher and the receiving party’s lower by that amount.
- The same seat would have moved if the next party had 980 more votes, or the receiving party 2,059 fewer.
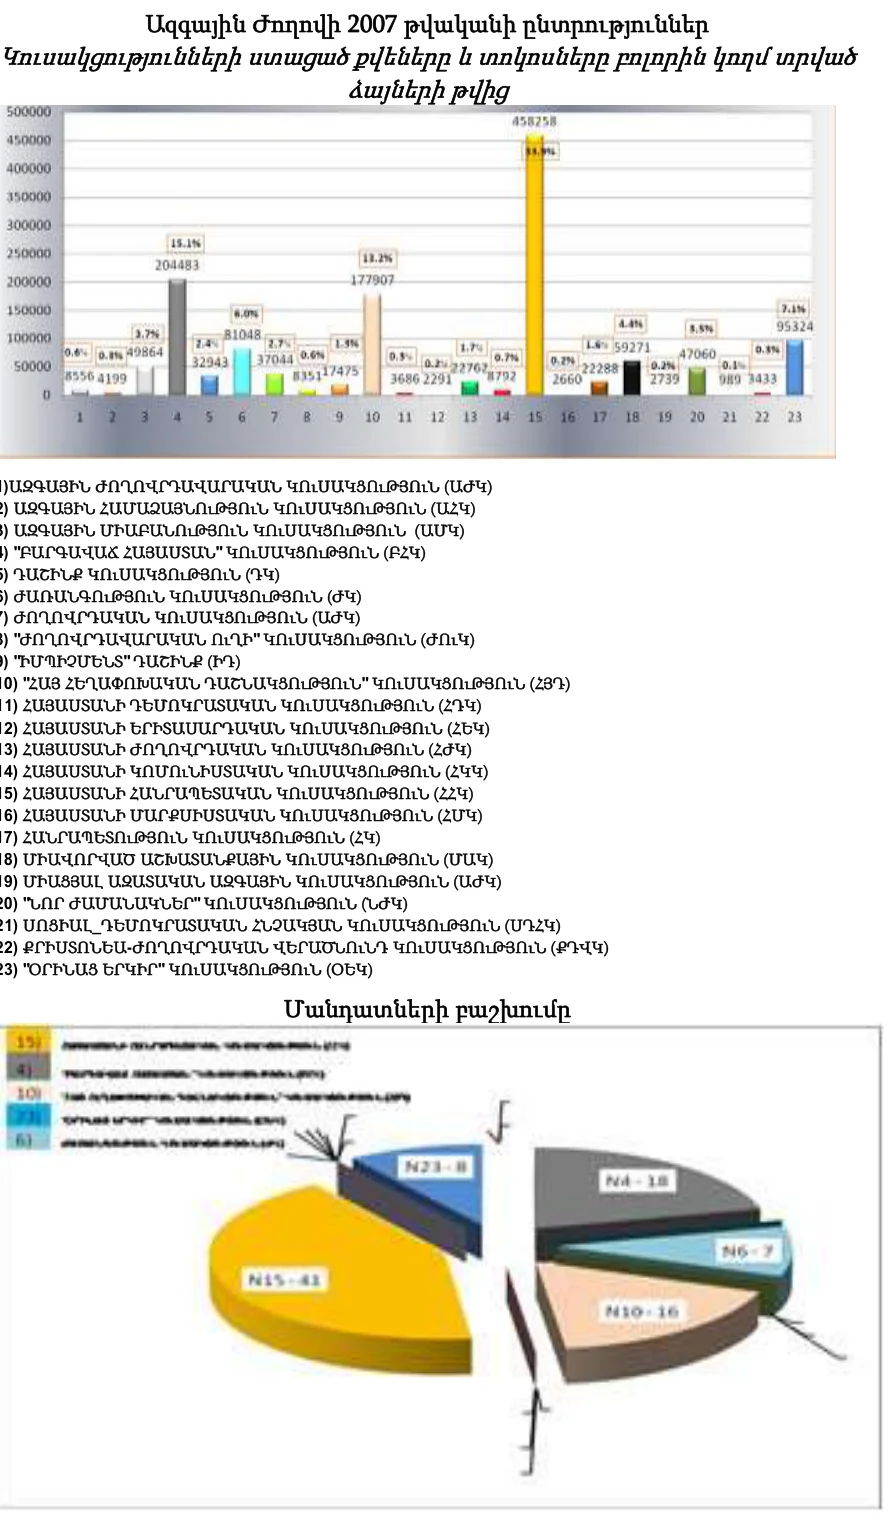
How to read this chart
The bars are the votes of the 23 lists with their share in boxes; the pie chart shows the 90 seats: Republican Party (15) 41, Prosperous Armenia (4) 18, ARF (10) 16, Rule of Law (23) 8, Heritage (6) 7.
What it shows
Heritage, with 5.8% of the vote, received 7 seats. The next lists were United Labour (4.4%, 59,271 votes), National Unity (3.7%) and New Times (3.5%).
Why the rule rewards stuffing
Adding inaccuracies to the base raises the threshold for everyone, “to the detriment of parties near the quota and to the benefit of those that have passed it”. And if ballots are stuffed for a party, they count both as its votes and as inaccuracies for all, so the stuffing party gains seats while its rivals near the threshold lose. With 14,665 inaccuracies against a seat that could move for 664, the allocation of the 90 seats was not determined by the votes, the author concludes; under the Code the effect of inaccuracies on the result was not even considered.
A comparison of clean and suspect stations: seats from clean and suspect stations.
Source: “The Electoral Rights and Falsifications of Elections” (2010, in Armenian), the earlier Armenian book by the same author, which analyses the officially published figures of each election. The figures here are taken from it; page numbers refer to the PDF.
Data and sources on this site
From the book
This article is based on the 2010 Armenian edition of Electoral Rights and Election Falsification by Lyudvig Khachatryan, which explains the full method, the formulas and the cases behind it.