Armenian Elections 2012–2026 Compared: How the Winner’s Vote Changes With Turnout
From 2012 to 2017 the ruling side was always strongest where turnout was highest; in 2018 the pattern disappeared, and in 2021 it reversed.
Original page on electionscount.info: Distribution of votes by turnout, 2017 (one of eight pages compared)For every election since 2012 the site has the same tool: a page that splits all polling stations into two groups at a turnout percentage you choose and shows how each group voted. The address is the same in every year, only the number after tk= changes. This article puts the eight pages side by side, each at a limit close to that election’s national turnout, and then compares them at the same limits of 70% and 80%.
The idea behind the comparison is simple. Real voters who turn out in larger numbers do not all vote for one side. If a list’s share keeps rising as turnout rises, while the others fall, the extra participants at high-turnout stations are votes added for that list. The method is explained in comparing election numbers.
The eight pages
| Election | Page | Language | Bars show | Red line |
|---|---|---|---|---|
| 2012 parliamentary | /2012/kusak_gr-en.php | English (also Armenian, kusak_gr.php) | % of participants | 5% / 7% threshold |
| 2013 presidential | /2013/kusak_gr-en.php | English | % of participants | 50% |
| 2013 Yerevan council | /yerevan/kusak_gr-en.php | English | % of participants | 7% threshold |
| 2015 referendum | /2015/kusak_gr.php | Armenian | % of registered voters | 25% of voters |
| 2017 parliamentary | /2017/kusak_gr.php | Armenian | % of participants | 5% / 7% |
| 2018 parliamentary | /2018/kusak_gr.php | Armenian | % of participants | 5% / 7% |
| 2021 parliamentary | /2021/kusak_gr.php | Armenian | % of participants | 5% / 7% |
| 2026 parliamentary | /2026/kusak_en.php | English (also Armenian, kusak_gr.php) | % of participants | 4% / 8% |
Two things differ between the pages and matter when reading them. In 2015 the split is “≥ limit” and “< limit”; in 2017–2026 it is “> limit” and “≤ limit”, so a station exactly at the limit falls on the other side. (On all the pages the lower-turnout group is on the left; in the pictures below it is on the right.) And the 2015 bars are shares of all registered voters, because the referendum rule required YES from a quarter of them; for the comparison below, those shares are converted to shares of participants.
Each election at its own turnout
2012 parliamentary elections, split at 62%
How to read this chart
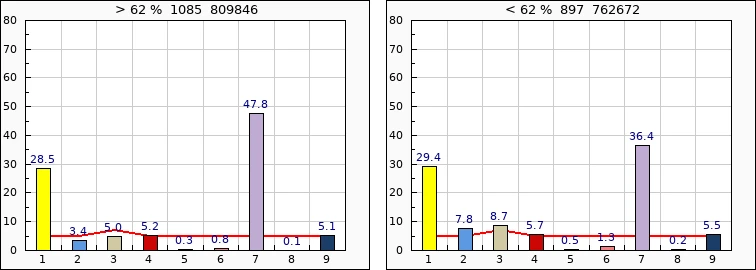
Left: 1,085 stations above 62% (809,846 participants). Right: 897 stations below (762,672). Bars 1–9: 1 Prosperous Armenia, 2 Heritage, 3 ANC alliance, 4 ARF, 5 Democratic Party, 6 Communist Party, 7 Republican Party (RPA), 8 United Armenians, 9 Rule of Law.
What it shows
RPA 47.8% above, 36.4% below. Prosperous Armenia is the same in both (28.5 and 29.4). Heritage and the ANC alliance are stronger below (7.8 and 8.7 against 3.4 and 5.0). See 2012 votes by turnout.
2013 presidential election, split at 60%
How to read this chart
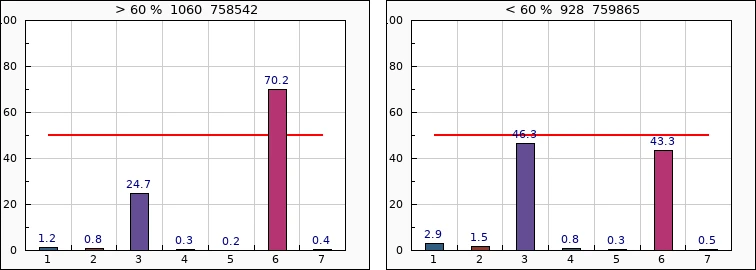
Left: 1,060 stations above 60% (758,542 participants). Right: 928 below (759,865). Bars: 1 Bagratyan, 2 Hayrikyan, 3 Raffi Hovannisian, 4 Ghukasyan, 5 Melikyan, 6 Serzh Sargsyan, 7 Sedrakyan. The red line is 50%, the share needed to win in the first round.
What it shows
The two halves of the electorate are equal in size, yet Sargsyan 70.2% above and 43.3% below, where Hovannisian leads with 46.3%. See 2013 votes by turnout.
2013 Yerevan council election, split at 54%
How to read this chart
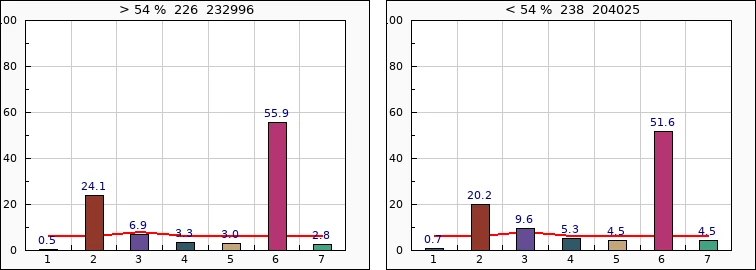
Left: 226 stations above 54% (232,996 participants). Right: 238 below (204,025). Bars: 1 Arakelutyun, 2 Prosperous Armenia, 3 Barev Yerevan alliance, 4 ANC, 5 ARF, 6 Republican Party (RPA), 7 Rule of Law. The red line is the 7% threshold.
What it shows
The capital alone, three months after the presidential election: RPA 55.9% above and 51.6% below; Prosperous Armenia 24.1% and 20.2%. Barev Yerevan, Hovannisian’s alliance, is stronger at lower turnout (9.6% against 6.9%). Only six stations exceeded 70% and none 80%.
2015 constitutional referendum, split at 51%
How to read this chart
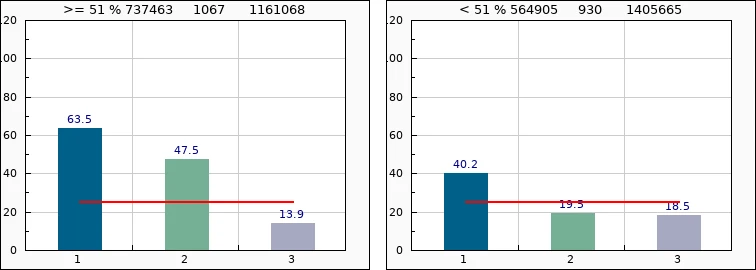
Left: 1,067 stations at or above 51%. Right: 930 below. Bars: 1 turnout, 2 YES, 3 NO, all as % of registered voters. The red line is 25% of voters, the YES needed.
What it shows
YES is 47.5% of voters above and 19.5% below; as a share of participants, 74.8% and 48.5%. See 2015 YES and NO by turnout.
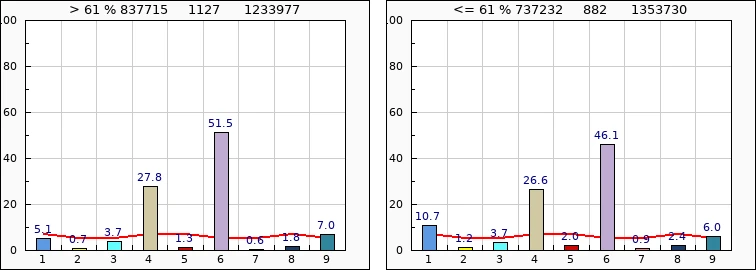
2017 parliamentary elections, split at 61%
How to read this chart
Left: 1,127 stations above 61%. Right: 882 at or below. Bars: 1 Yelk alliance, 2 Free Democrats, 3 Armenian Renaissance, 4 Tsarukyan alliance, 5 Congress–HZhK, 6 RPA, 7 Communist Party, 8 ORO alliance, 9 ARF.
What it shows
RPA 51.5% above and 46.1% below; Yelk 5.1% and 10.7%. See 2017 votes by turnout.
2018 parliamentary elections, split at 49%
How to read this chart
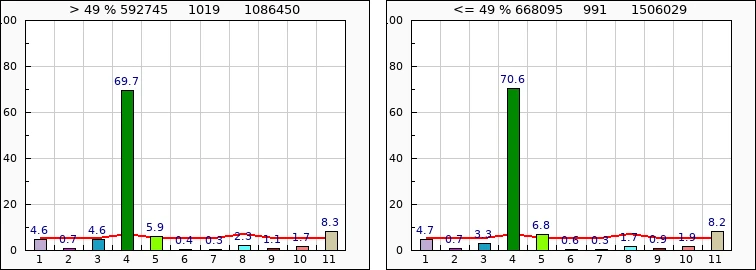
Left: 1,019 stations above 49% (592,745 participants). Right: 991 at or below (668,095). Bars: 1 RPA, 2 Christian-Popular Renaissance, 3 ARF, 4 My Step, 5 Bright Armenia, 6 Citizen’s Decision, 7 National Progress, 8 We, 9 Rule of Law, 10 Sasna Tsrer, 11 Prosperous Armenia.
What it shows
The two panels are almost identical: My Step 69.7% above and 70.6% below; Prosperous Armenia 8.3 and 8.2; Bright Armenia 5.9 and 6.8. See 2018 votes by turnout.
2021 parliamentary elections, split at 49%

How to read this chart
Left: 1,149 stations above 49% (770,731 participants). Right: 859 at or below (510,443). Bars 1–26 are the lists in ballot order; 3 is Civil Contract, 24 the Armenia alliance, 6 the I Have Honor alliance, 14 Prosperous Armenia.
What it shows
The direction is reversed: the winner, Civil Contract, has 49.7% at the higher-turnout stations and 59.6% at the others, while the second-placed Armenia alliance has 22.9% and 18.0%. See 2021 votes by turnout.
2026 parliamentary elections, split at 59%

How to read this chart
Left: 997 stations above 59% (671,935 participants). Right: 1,009 at or below (789,136). Bars are the lists in ballot order; 16 is Civil Contract, 3 the Strong Armenia alliance, 17 the Armenia alliance.
What it shows
Flat again: Civil Contract 50.1% and 49.5%, Strong Armenia 22.9% and 23.6%, the Armenia alliance 10.0% and 9.9%. See 2026 votes by turnout.
The same limit for every election
How to read this chart
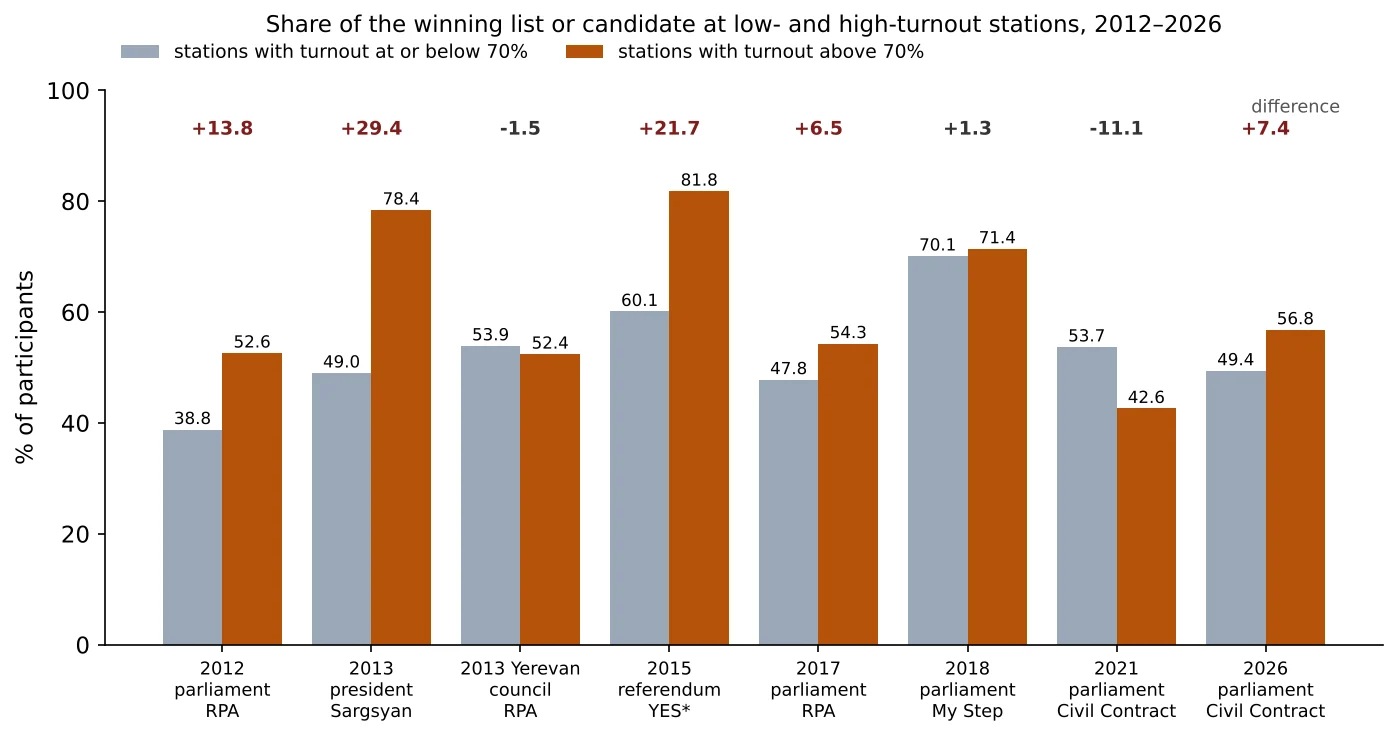
For each election: grey, the winner’s share at stations with turnout of 70% or less; brown, at stations above 70%. The figure above each pair is the difference in percentage points. *For the 2015 referendum, YES as a share of participants, calculated from the page’s shares of voters.
What it shows
- 2012, 2013, 2015: the winner gains 14 to 29 points at the high-turnout stations.
- 2017: +6.5.
- 2018: +1.3, practically none.
- 2021: −11.1: the winner is weaker where turnout is high, and the Armenia alliance stronger (38.6% against 20.8%).
- 2026: +7.4 at 70%, from 183 stations with 70,868 participants, about 5% of the total.
- 2013 Yerevan council: −1.5, from only six stations above 70%.
From 2012 to 2017 the ruling side was consistently strongest where turnout was highest; in 2018 the effect disappeared. In 2021 and 2026 it appears only in small groups of stations, in 2021 in favour of the opposition.
How to read this chart
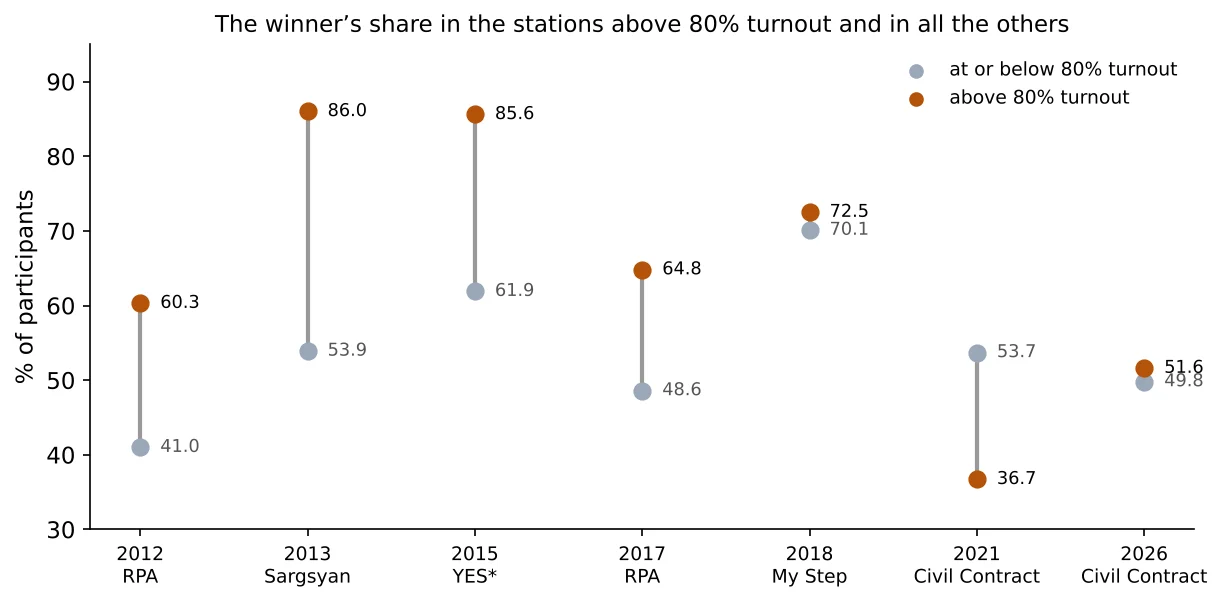
Each vertical line joins the winner’s share at stations at or below 80% turnout (grey dot) with its share at stations above 80% (brown dot). The longer the line, the more the very-high-turnout stations differ from the rest.
What it shows
- 2013: Sargsyan 86.0% above 80%, 53.9% elsewhere.
- 2015: YES 85.6% against 61.9%.
- 2017: RPA 64.8% against 48.6%.
- 2012: RPA 60.3% against 41.0%.
- 2018: My Step 72.5% against 70.1%.
- 2026: Civil Contract 51.6% against 49.8%.
- 2021: Civil Contract 36.7% against 53.7%; the Armenia alliance 46.5% against 20.9%.
How to read this chart
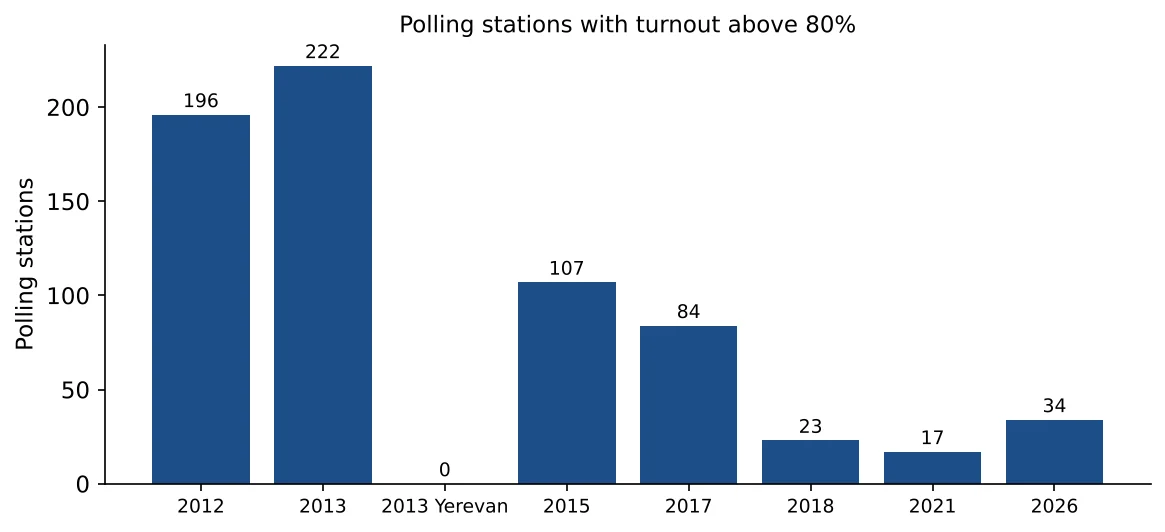
Each bar counts the polling stations in the left panel of the page at tk=80.
What it shows
About 200 stations reported over 80% turnout in 2012 and 2013, about 100 in 2015 and 2017, and 17–34 since 2018. In Yerevan’s council election of 2013 there were none; the page then shows an empty picture instead of a chart.
What the comparison says
Read together, the eight pages show a change that no single page can: the steep rise of the winner’s share with turnout, typical of 2012–2017 and strongest in the 2013 presidential election and the 2015 referendum, is absent in 2018 and largely absent in 2021 and 2026. The small groups of very-high-turnout stations that remain in recent elections are where the station-by-station checks of polling station capacity and the turnout and speed comparison are most useful.
Try it yourself: open any of the pages above and change the number after tk=. The same number on two pages compares the two elections directly.
Data and sources on this site
From the book
This article is based on Chapter VI of Electoral Rights and Election Falsification by Lyudvig Khachatryan, which explains the full method, the formulas and the cases behind it.