Armenia 2018: Party Votes by Polling-Station Turnout
In 2018 My Step’s share was the same, about 70%, at low- and high-turnout stations alike: no list gained as turnout rose.
Original page on electionscount.info: Distribution of votes by turnout, 2018Armenia held early parliamentary elections on 9 December 2018, half a year after the change of power. Eleven lists stood. Nikol Pashinyan’s My Step alliance won about 70% of the vote; Prosperous Armenia and Bright Armenia also passed the threshold (5% for parties, 7% for alliances). Turnout was 48.6%.
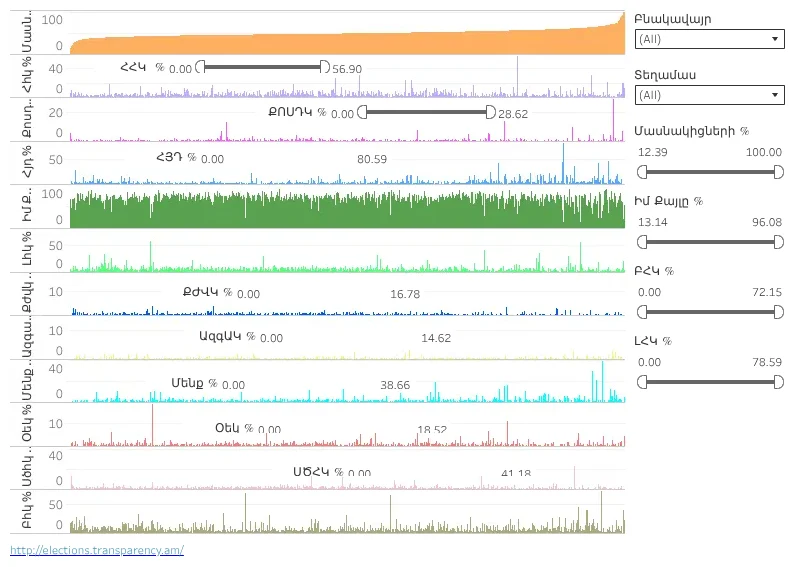
The page “Distribution of votes by turnout” sorts all polling stations by turnout and draws, in that same order, the share of every list. Above the chart it gives the national shares: My Step 70.16%, Prosperous Armenia 8.23%, Bright Armenia 6.35%, RPA 4.69%, ARF 3.87%, We 2.00%, Sasna Tsrer 1.81%, Rule of Law 0.98%, CPR 0.68%, Citizen’s Decision 0.51%, National Progress 0.33%.
How to read this chart
- Top (orange): turnout at each station, sorted from lowest to highest.
- Below: one strip per list, in ballot order, showing its share at the same stations; the dark green strip is My Step.
- Right side: choose a community or a station, and set ranges for turnout (12.39–100%) and for the shares of My Step (13.14–96.08%), Prosperous Armenia (0–72.15%) and Bright Armenia (0–78.59%).
Lists on the site’s tables, in ballot order: ՀՀԿ Republican Party (RPA); ՔՈՍԴԿ Christian-Popular Renaissance (CPR); ՀՅԴ ARF Dashnaktsutyun; ԻՄ ՔԱՅԼԸ My Step alliance; ԼՀԿ Bright Armenia; ՔԺՎԿ Citizen’s Decision; ԱզգԱԿ National Progress; ՄԵՆՔ We alliance; ՕԵԿ Rule of Law; ՍԾՀԿ Sasna Tsrer; ԲՀԿ Prosperous Armenia (PAP).
What it shows
The My Step strip is equally tall from left to right: its share does not rise with turnout. The small lists show isolated spikes, single villages where one party took most of the vote.
A note on the page: as on the voting-speed page, the Tableau code is printed as text on the Armenian page instead of the chart.
The same data by turnout band
How to read this chart
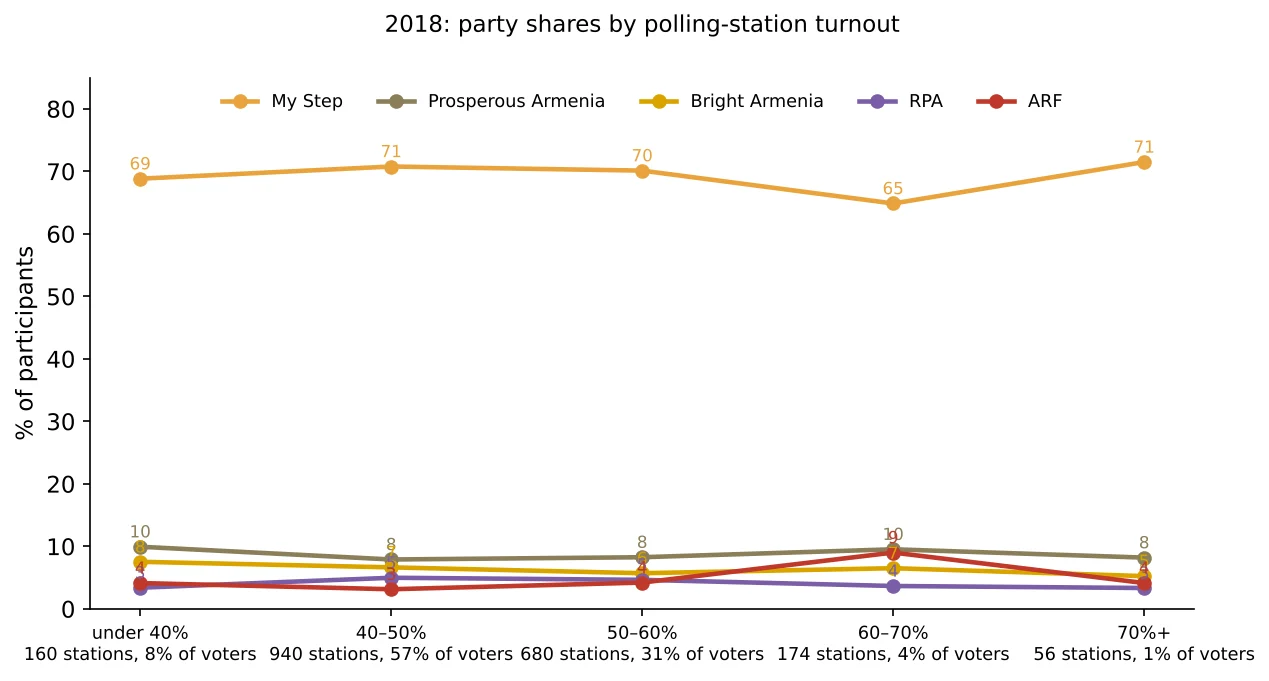
Stations are grouped by turnout; under each group are its stations and share of voters. Each line is a list’s share of participants in that group.
What it shows
- My Step: 68.8% under 40% turnout, 70.8% at 40–50%, 70.1% at 50–60%, 64.9% at 60–70%, 71.5% above 70%.
- Prosperous Armenia 8–10% and Bright Armenia 5–7.5% in every band. ARF rises to 9% at 60–70%, where several of its strongholds are.
Unlike 2012–2017, no list gains as turnout rises. This flat picture is what an election without added ballots looks like, and it is the baseline against which the earlier charts can be read.
Compare: 2017, where the ruling party rose from 46% to 79% with turnout, and 2013. The 2021 picture is in votes by turnout, 2021.
Data and sources on this site
From the book
This article is based on Chapter VI of Electoral Rights and Election Falsification by Lyudvig Khachatryan, which explains the full method, the formulas and the cases behind it.