Armenia 2017 Parliamentary Elections: Party Votes Above and Below Each Turnout Limit
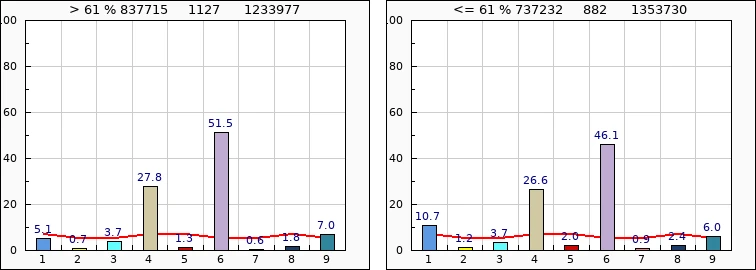
In polling stations with turnout at or below 61%, the ruling RPA had 46.1% of the vote; above 90% turnout it had 79%. The opposition Yelk alliance fell below its threshold in the high-turnout half.
Original page on electionscount.info: Distribution of votes depending on turnout, 2017 (tk=61)Armenia’s parliamentary elections of 2 April 2017 were held under a new Electoral Code. A party needed 5% of the votes to enter parliament, an alliance 7%. The page “Distribution of votes depending on turnout, 2017” divides the 2,009 polling stations at a turnout limit you choose and shows how the two groups voted. The limit is the number after tk= in the address; type another number in the field and press the button to change it.
How to read the two panels
- Left: stations with turnout above the limit (
>). Right: stations with turnout at or below it (<=). On the site itself the two panels are the other way round: “≤” on the left, “>” on the right. - Bars 1–9: parties and alliances, numbered as on the ballot, as % of the participants in the group.
- Red line: the threshold, 5% for parties and 7% for alliances, which is why it steps up and down between bars.
Parties and alliances by number: 1 Yelk (Way Out) alliance; 2 Free Democrats; 3 Armenian Renaissance; 4 Tsarukyan alliance; 5 Congress–People’s Party of Armenia alliance (ANC–HZhK); 6 Republican Party of Armenia (RPA); 7 Communist Party of Armenia; 8 Ohanyan–Raffi–Oskanian (ORO) alliance; 9 ARF Dashnaktsutyun.
The split at 61%
How to read this chart
The page opened with tk=61. Each panel heading gives the limit, the participants, the stations and the voters of that group. Bars 1–9 are the parties and alliances, as % of participants in the group; the red line is the threshold.
What it shows
The national turnout was 60.86%, so 61% splits the country in two. The 1,127 stations above 61% had fewer voters (1,233,977) than the 882 stations below (1,353,730) but more participants (837,715 against 737,232).
- RPA: 51.5% above, 46.1% below.
- Tsarukyan alliance: 27.8% and 26.6%, almost the same.
- Yelk alliance: 5.1% above, under its 7% threshold; 10.7% below.
- ARF: 7.0% and 6.0%.
In the stations with ordinary turnout the ruling party had 46%, short of a majority of the votes, and Yelk had more than twice its high-turnout share.
Raising the limit: 70%, 80%, 90%
How to read this chart
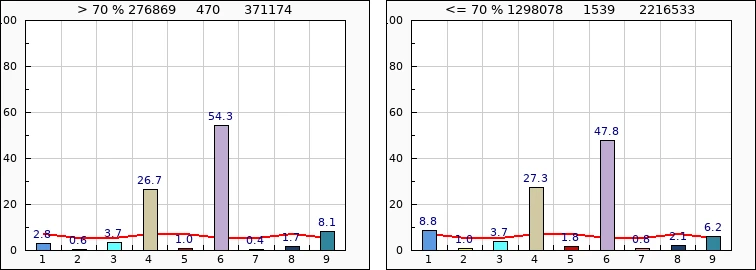
The page opened with tk=70. Each panel heading gives the limit, the participants, the stations and the voters of that group. Bars 1–9 are the parties and alliances, as % of participants in the group; the red line is the threshold.
What it shows
470 stations reported more than 70% turnout. RPA had 54.3% there; Yelk dropped to 2.8%. ARF rose to 8.1%.
How to read this chart
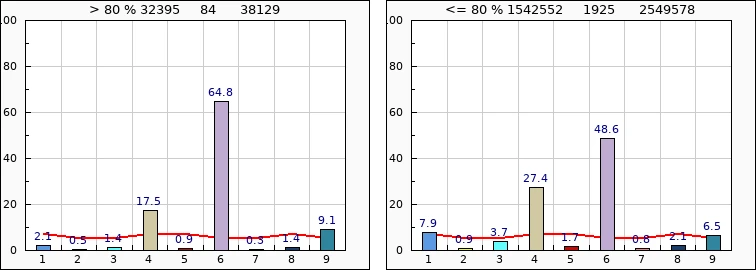
The page opened with tk=80. Each panel heading gives the limit, the participants, the stations and the voters of that group. Bars 1–9 are the parties and alliances, as % of participants in the group; the red line is the threshold.
What it shows
84 stations above 80%: RPA 64.8%, Tsarukyan alliance down to 17.5%, Yelk 2.1%, ARF 9.1%.
How to read this chart
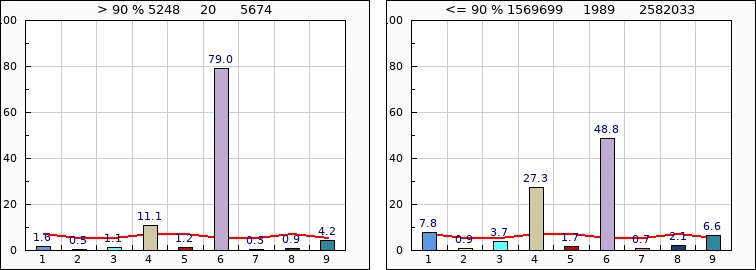
The page opened with tk=90. Each panel heading gives the limit, the participants, the stations and the voters of that group. Bars 1–9 are the parties and alliances, as % of participants in the group; the red line is the threshold.
What it shows
20 stations, with 5,674 voters, reported more than 90% turnout. RPA had 79.0% of their participants, the Tsarukyan alliance 11.1%, ARF 4.2% and every other list less than 2%.
As turnout rises, only the ruling party gains. Real high turnout would raise all parties’ votes in proportion; votes added to the count go to one list.
Lowering the limit: 50%, 40%, 30%, 20%
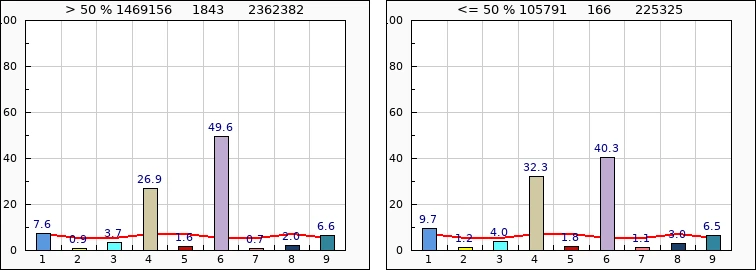
How to read this chart
The page opened with tk=50. Each panel heading gives the limit, the participants, the stations and the voters of that group. Bars 1–9 are the parties and alliances, as % of participants in the group; the red line is the threshold.
What it shows
166 stations, with 225,325 voters, had 50% turnout or less. There RPA had only 40.3% and the Tsarukyan alliance 32.3%; Yelk 9.7%, ARF 6.5%. Above 50%, RPA had 49.6%.
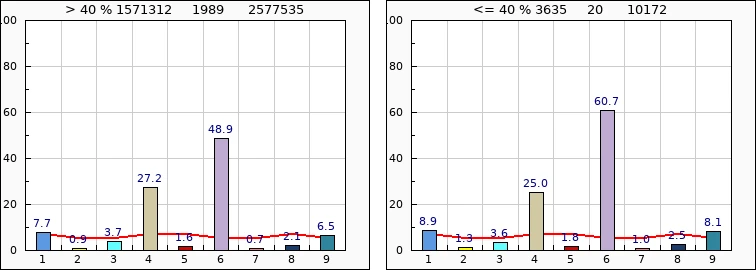
How to read this chart
The page opened with tk=40. Each panel heading gives the limit, the participants, the stations and the voters of that group. Bars 1–9 are the parties and alliances, as % of participants in the group; the red line is the threshold.
What it shows
Only 20 stations (10,172 voters) were at 40% or less. Their RPA share, 60.7%, is higher again: some of these are small stations where very few people voted, so a handful of votes changes the percentages.
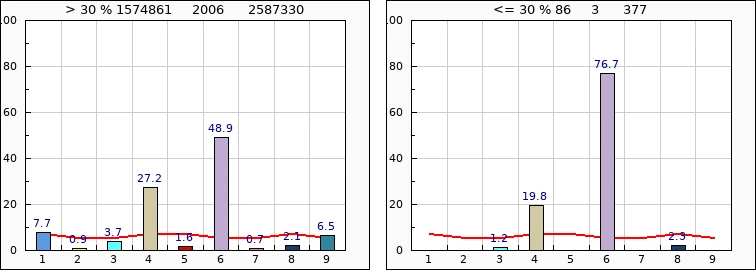
How to read this chart
The page opened with tk=30. Each panel heading gives the limit, the participants, the stations and the voters of that group. Bars 1–9 are the parties and alliances, as % of participants in the group; the red line is the threshold.
What it shows
Three stations with 377 voters and 86 participants: RPA 76.7%, Tsarukyan alliance 19.8%.
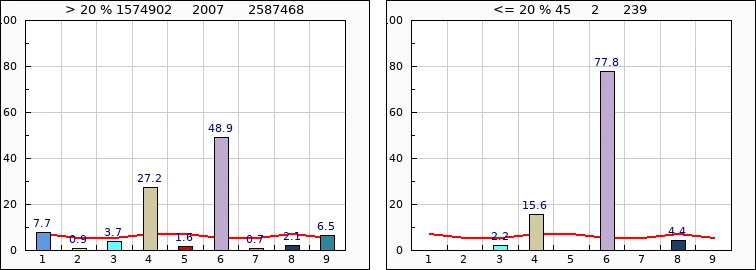
How to read this chart
The page opened with tk=20. Each panel heading gives the limit, the participants, the stations and the voters of that group. Bars 1–9 are the parties and alliances, as % of participants in the group; the red line is the threshold.
What it shows
Two stations with 239 voters and 45 participants. With so few votes, the percentages mean little.
All splits together
How to read this chart
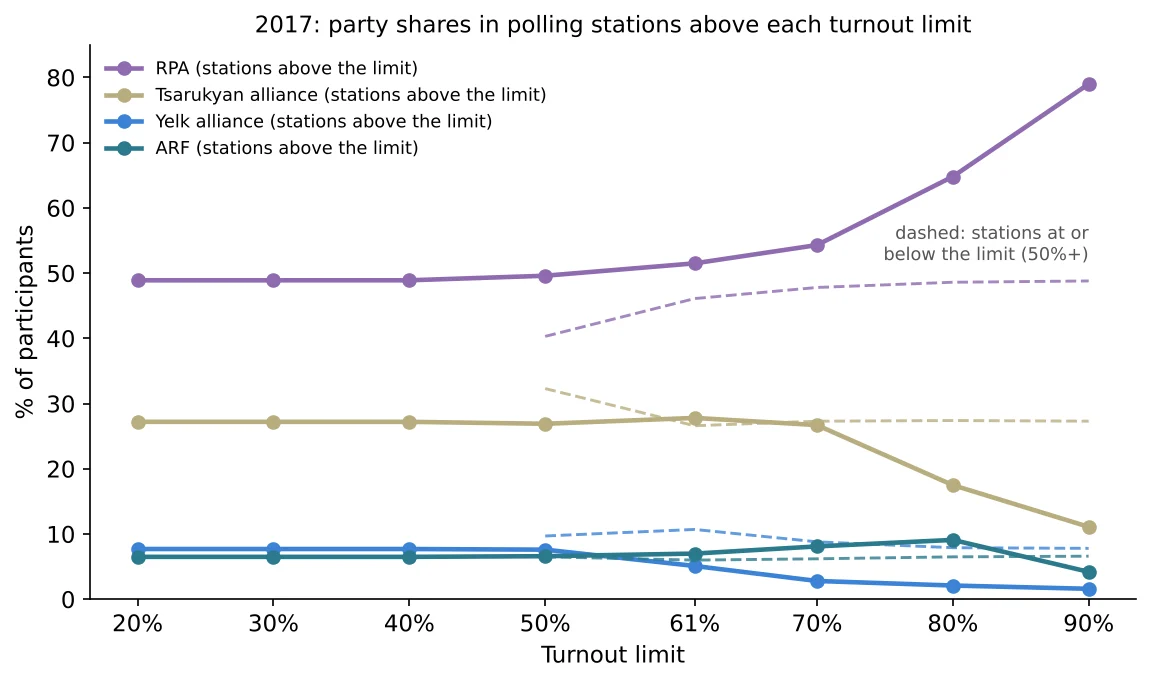
Solid lines: each party’s share in the stations above the limit on the horizontal axis. Dashed lines: the share in the stations at or below the limit, shown from 50% up, where the groups are large enough to compare.
What it shows
The RPA line is flat until 50% and then climbs steeply: 49.6% → 51.5% → 54.3% → 64.8% → 79.0%. The Yelk line falls from 7.6% to 1.6%; the Tsarukyan alliance holds at about 27% until 70% and then drops. ARF rises slightly with turnout until 80%.
What it means
Comparing parties in high- and low-turnout stations is the method of the election numbers comparison. In 2017 the result is clear: RPA’s majority is built in the stations with turnout above 61%, which are also the stations that reported registering voters faster than possible, see 668 stations faster than 60 seconds. The same tool for other years: 2012, 2013, 2015, 2021.
Notes on the page: its heading reads “Elections in ARMENIA 2021” although the data are from 2017, and the “download” link under the chart opens a file of the 2013 presidential election (resultarm18.02.13n.xls) rather than the 2017 data.
Data and sources on this site
From the book
This article is based on Chapter VI of Electoral Rights and Election Falsification by Lyudvig Khachatryan, which explains the full method, the formulas and the cases behind it.