Armenia 2013: Communities Sorted by Turnout, and How Their Votes Changed
In communities with turnout under 60%, home to 61% of voters, Sargsyan and Hovannisian were practically tied: 47.0% to 46.8%.
Original page on electionscount.info: Results by communities (page 1), 2013Armenia elected its president on 18 February 2013. Seven candidates stood; the incumbent Serzh Sargsyan (Republican Party) was declared the winner in the first round, and Raffi Hovannisian (Heritage) came second. The monitoring site for this election is at elections.transparency.am/2013.
The page “Results by communities (page 1)” sorts all of Armenia’s communities by turnout, from the lowest to the highest, and draws three charts in that same order: turnout, the share of the winner, and the share of the runner-up.
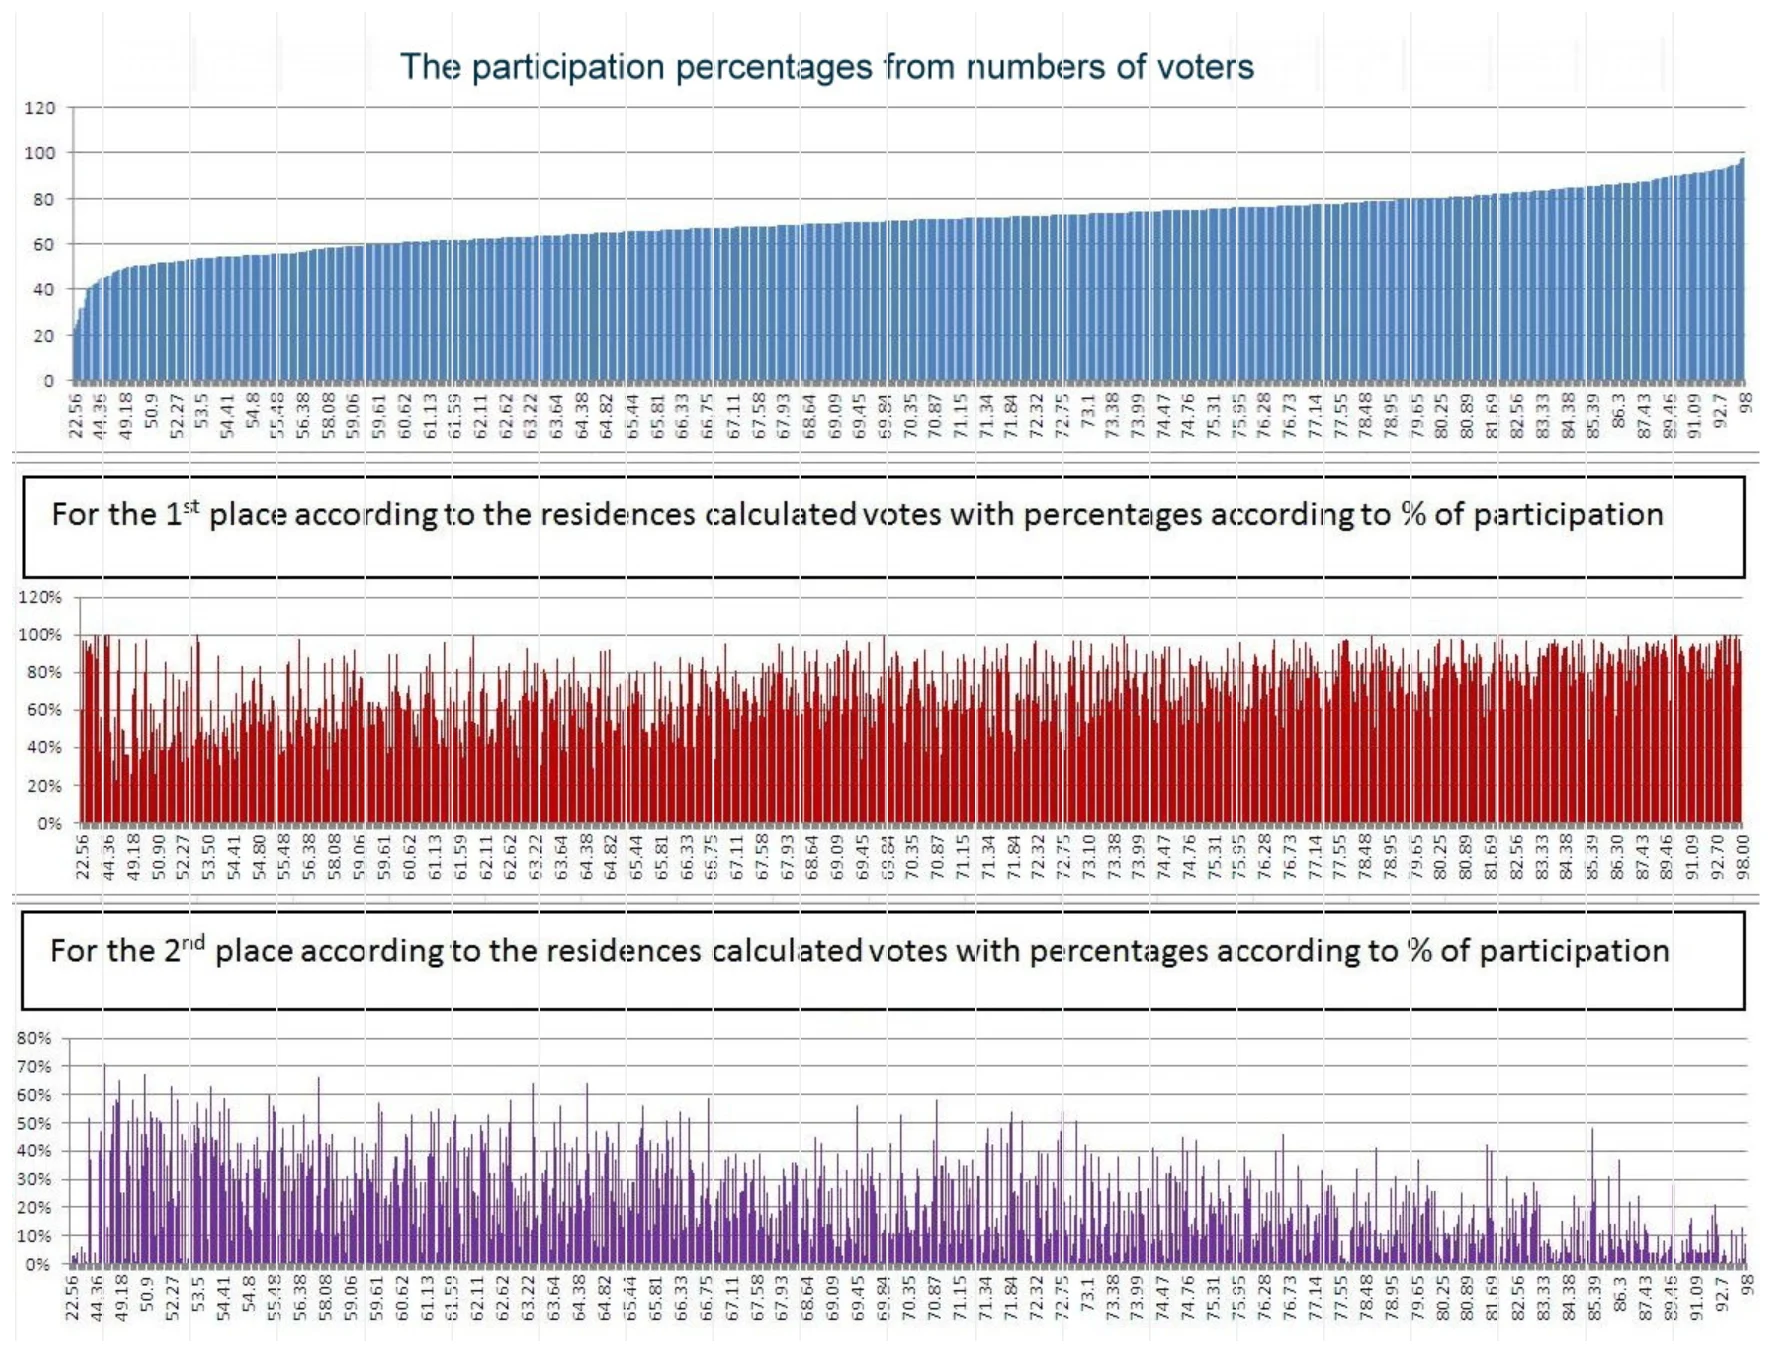
How to read this chart
- Top (blue): turnout in each community, % of voters, sorted from 22.56% (Metsadzor) to 98% (Apaven). The labels under the axis are turnout values.
- Middle (red): Serzh Sargsyan’s share of the valid votes in the same community, in the same order.
- Bottom (purple): Raffi Hovannisian’s share, in the same order.
- Each thin bar is one community, so a bar in the middle or bottom chart sits exactly under the turnout of that community in the top chart.
- On the page, pointing at a community shows its name, turnout and the two shares.
What it shows
Moving to the right, towards higher turnout, the red bars rise until they touch 100% and the purple bars shrink to almost nothing. At the left, at turnout around 50%, the two candidates are close.
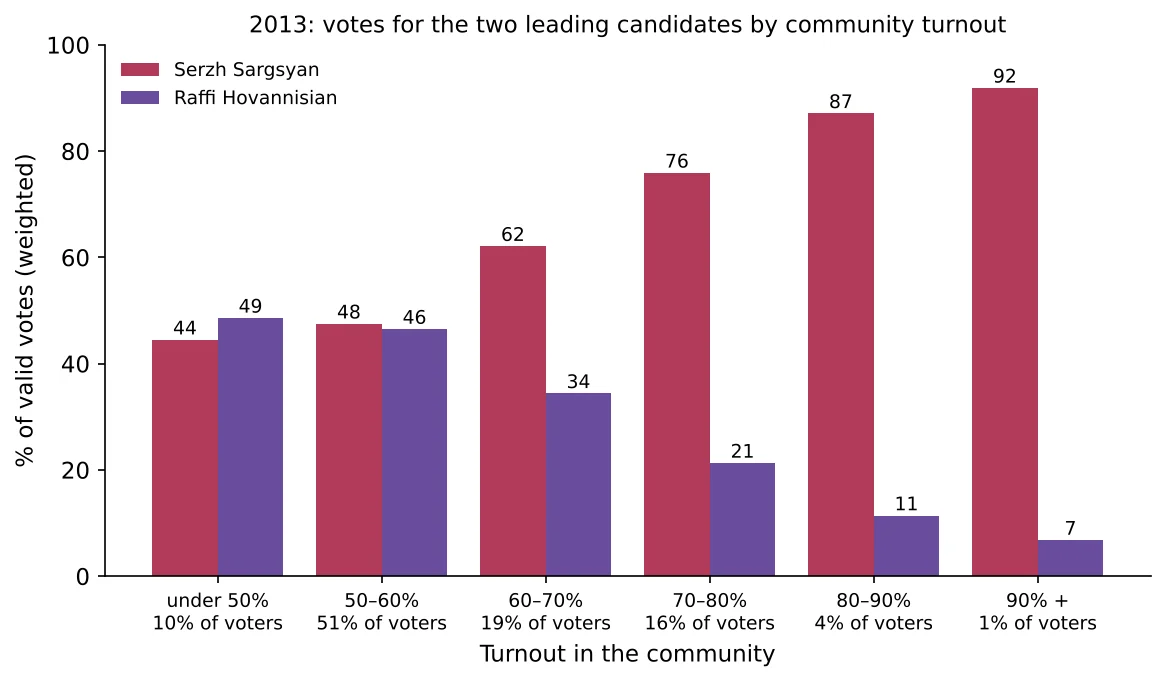
How to read this chart
The communities are grouped into turnout bands; under each band is its share of all voters. Bars show each candidate’s share of the valid votes in the band, weighted by the number of participants.
What it shows
- Communities with turnout under 60% hold 61% of all voters. Together they gave Sargsyan 47.0% and Hovannisian 46.8%, a near tie.
- Communities at 60% or more hold 39% of the voters and gave Sargsyan 71.5% and Hovannisian 25.6%.
- In the 37 communities at 90% or more, Sargsyan had 92%.
The communities where most people live, with ordinary turnout, were evenly split. The decisive margin came from the communities with unusually high turnout.
What to look for on the page
Several small villages report near-unanimous results at low and at high turnout alike: Sipan, Jamshlu, Sorik and Rya Taza gave Sargsyan 99–100% with turnout of 40–45%; Artanish, Verin Shorzha and Khoznavar 100% with 94–95% turnout. In 13 communities Sargsyan received every valid vote. In the cities the picture is different: Gyumri gave Hovannisian 69.6% and Vanadzor 59.4%.
The table with each community’s voters and participants is on the second page. The same sorting for the 2015 referendum is in results by community, 2015.
Data and sources on this site
From the book
This article is based on Chapter VI of Electoral Rights and Election Falsification by Lyudvig Khachatryan, which explains the full method, the formulas and the cases behind it.