Armenia 2013: The Community Results Table and Where Hovannisian Won
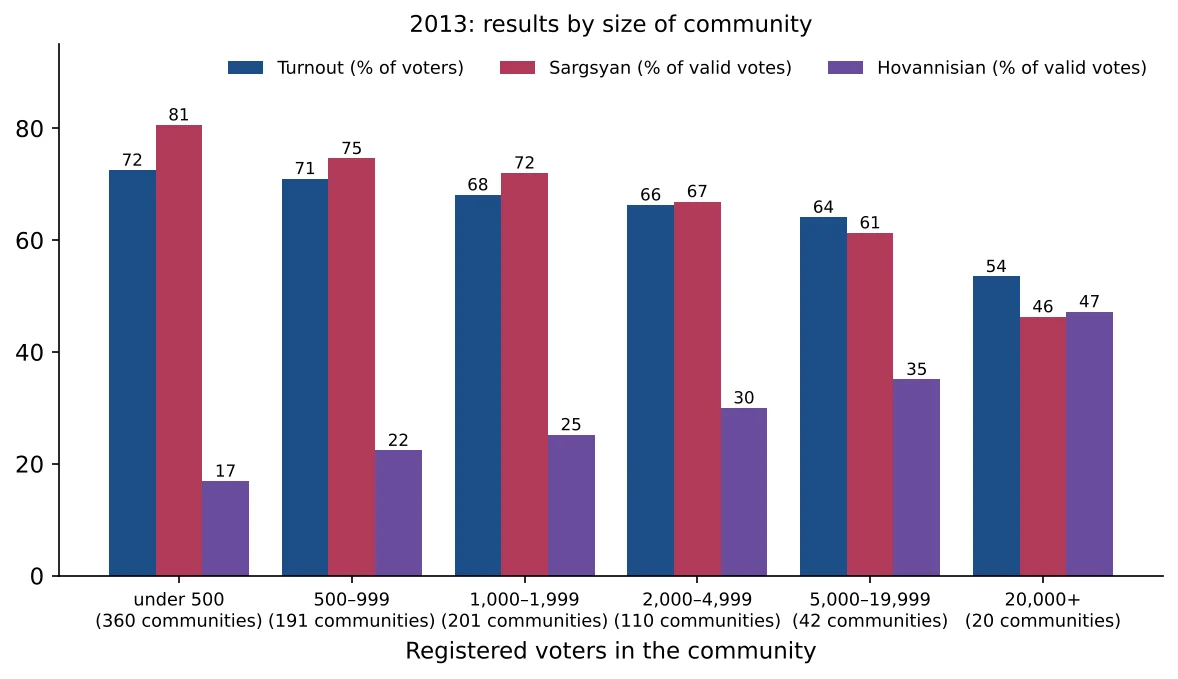
In the 20 largest towns and districts, home to half of the voters, Raffi Hovannisian was ahead; in villages under 500 voters Serzh Sargsyan had 80.6%.
Original page on electionscount.info: Results by communities (page 2), 2013Armenia elected its president on 18 February 2013. Seven candidates stood; the incumbent Serzh Sargsyan (Republican Party) was declared the winner in the first round, and Raffi Hovannisian (Heritage) came second. The monitoring site for this election is at elections.transparency.am/2013.
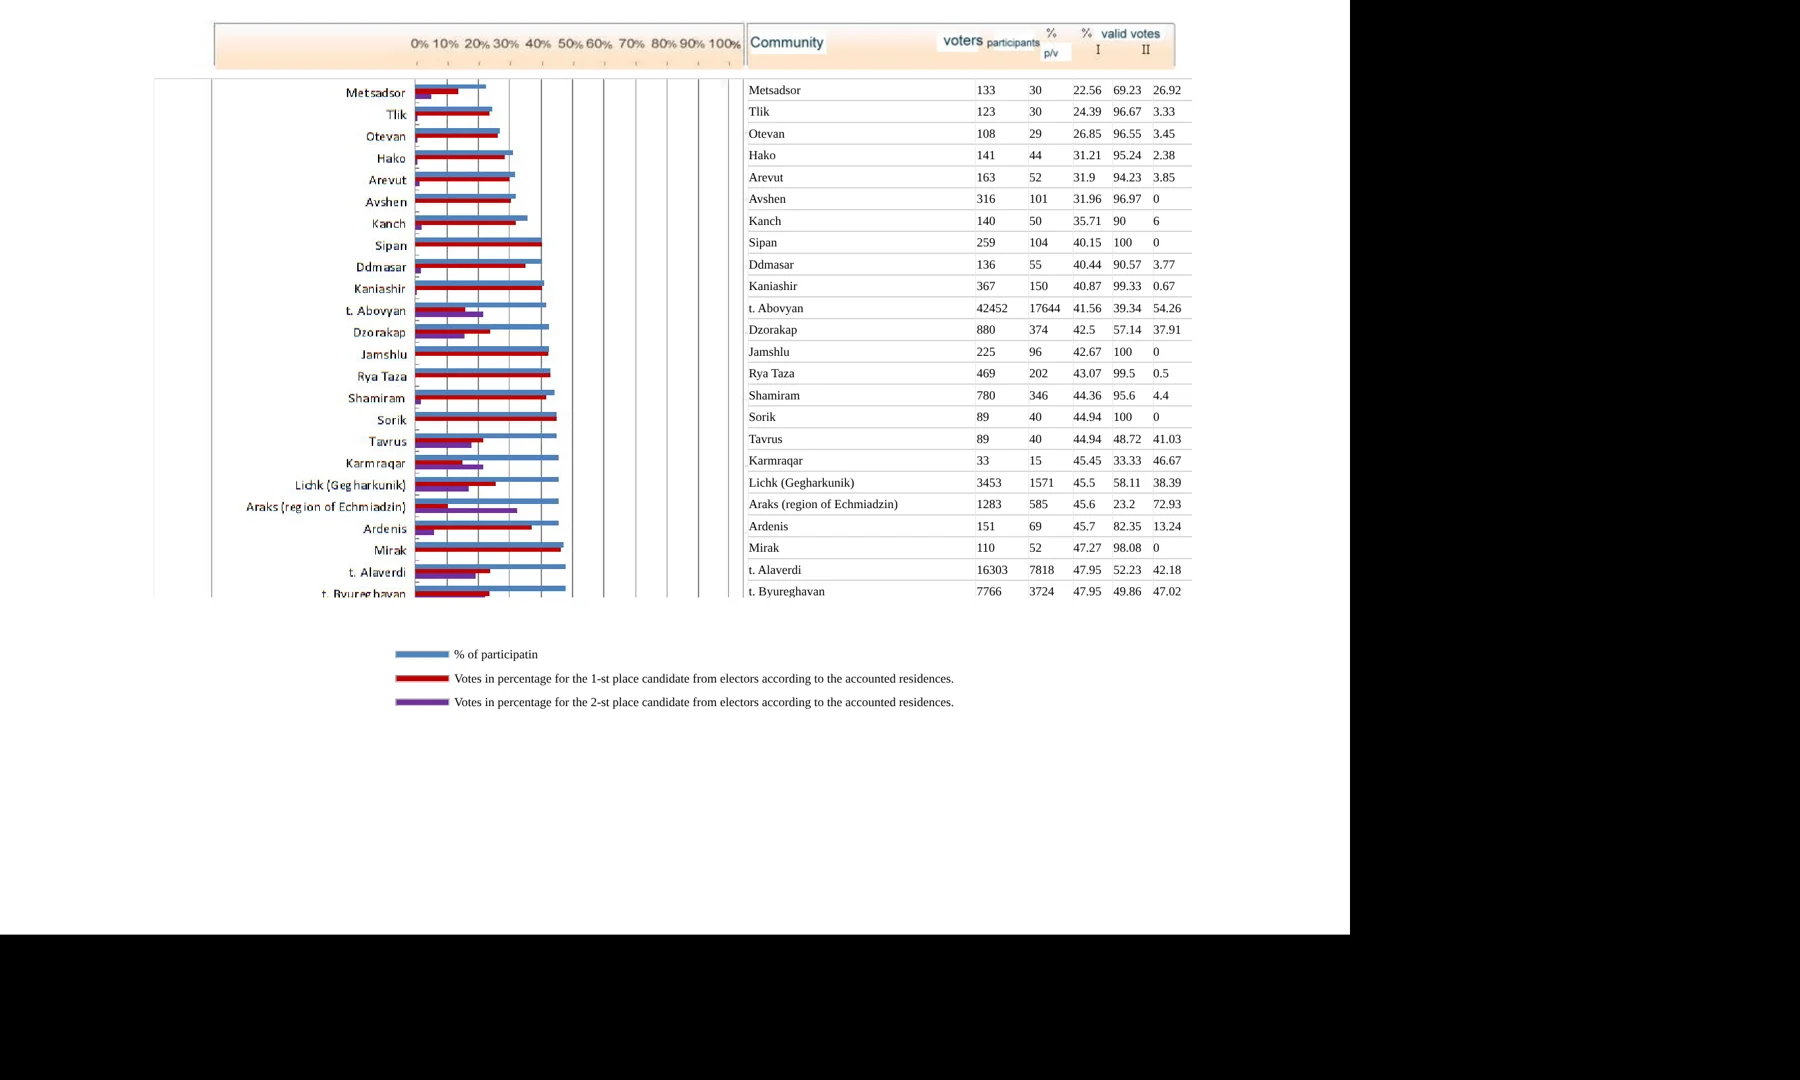
The page “Results by communities (page 2)” is the table behind the community charts: every community with its voters, participants, turnout and the shares of the first two candidates, with a small bar chart for each row.
How to read this chart
- Community, voters, participants.
- % p/v: turnout, participants as % of voters.
- % valid votes I and II: the shares of the first (Serzh Sargsyan) and second (Raffi Hovannisian) candidate among valid votes.
- Bars: blue turnout, red candidate I, purple candidate II. The legend says “from electors”, but the numbers in the table are shares of valid votes.
What it shows
The first rows are tiny villages with low turnout and lopsided results: Tlik, 30 participants, 96.67% for Sargsyan; Avshen, 101 participants, 96.97% and 0% for Hovannisian. Abovyan, a town of 42,452 voters, appears among them with 41.56% turnout and 54.26% for Hovannisian.
How to read this chart
Communities are grouped by registered voters. For each group: turnout (% of voters) and each candidate’s share of valid votes.
What it shows
- Under 500 voters (360 villages): turnout 72.5%, Sargsyan 80.6%, Hovannisian 16.9%.
- 20,000 voters or more (20 towns and Yerevan districts, 51% of all voters): turnout 53.5%, Sargsyan 46.3%, Hovannisian 47.2%.
In the large towns and Yerevan, home to half of the electorate, the runner-up was slightly ahead. The smaller the community, the higher both the turnout and the winner’s share.
Where Hovannisian won
Hovannisian received more votes than Sargsyan in 73 communities with 725,965 voters, 29% of the electorate. They include Gyumri (69.6%), Vanadzor (59.4%), Vagharshapat (57.1%), Armavir (58.6%), Abovyan (54.3%), Kapan (54.3%), Ashtarak, Artik, Ijevan, Spitak, Eghegnadzor, and the Yerevan districts of Ajapnyak and Arabkir. Together these communities had turnout of 53.5%.
Mistakes in the table
In four rows the name of a Yerevan district has been joined to the name of the next community: “Malatia-Sebastia- t. Kapan” holds the numbers of Kapan (31,201 voters), “Nor Nork- Tchartchakis” those of Charchakis, “Kanaker-Zeytun- Voskehask” those of Voskehask, and “Nork-Marash- Balak” those of Balak. The four districts themselves, with about 274,000 voters, are therefore missing from page 2. They are present on page 1 and in the Yerevan table, from which the figures in this article have been completed.
The method of comparing small and large communities is described in comparing election numbers.
Data and sources on this site
From the book
This article is based on Chapter VI of Electoral Rights and Election Falsification by Lyudvig Khachatryan, which explains the full method, the formulas and the cases behind it.