Armenia 2018: Results by Polling Station in Percent, and the Stations That Voted Differently
At most polling stations My Step got between 60% and 80%; a handful of villages voted almost unanimously for another list.
Original page on electionscount.info: Voting results in percentages, 2018Armenia held early parliamentary elections on 9 December 2018, half a year after the change of power. Eleven lists stood. Nikol Pashinyan’s My Step alliance won about 70% of the vote; Prosperous Armenia and Bright Armenia also passed the threshold (5% for parties, 7% for alliances). Turnout was 48.6%.
The page “Voting results in percentages” is the same table as the results in numbers, but each list’s votes are shown as a percentage of the participants at the station. That makes stations of different sizes comparable and makes unusual results easy to find: sort by any column.
How to read this chart
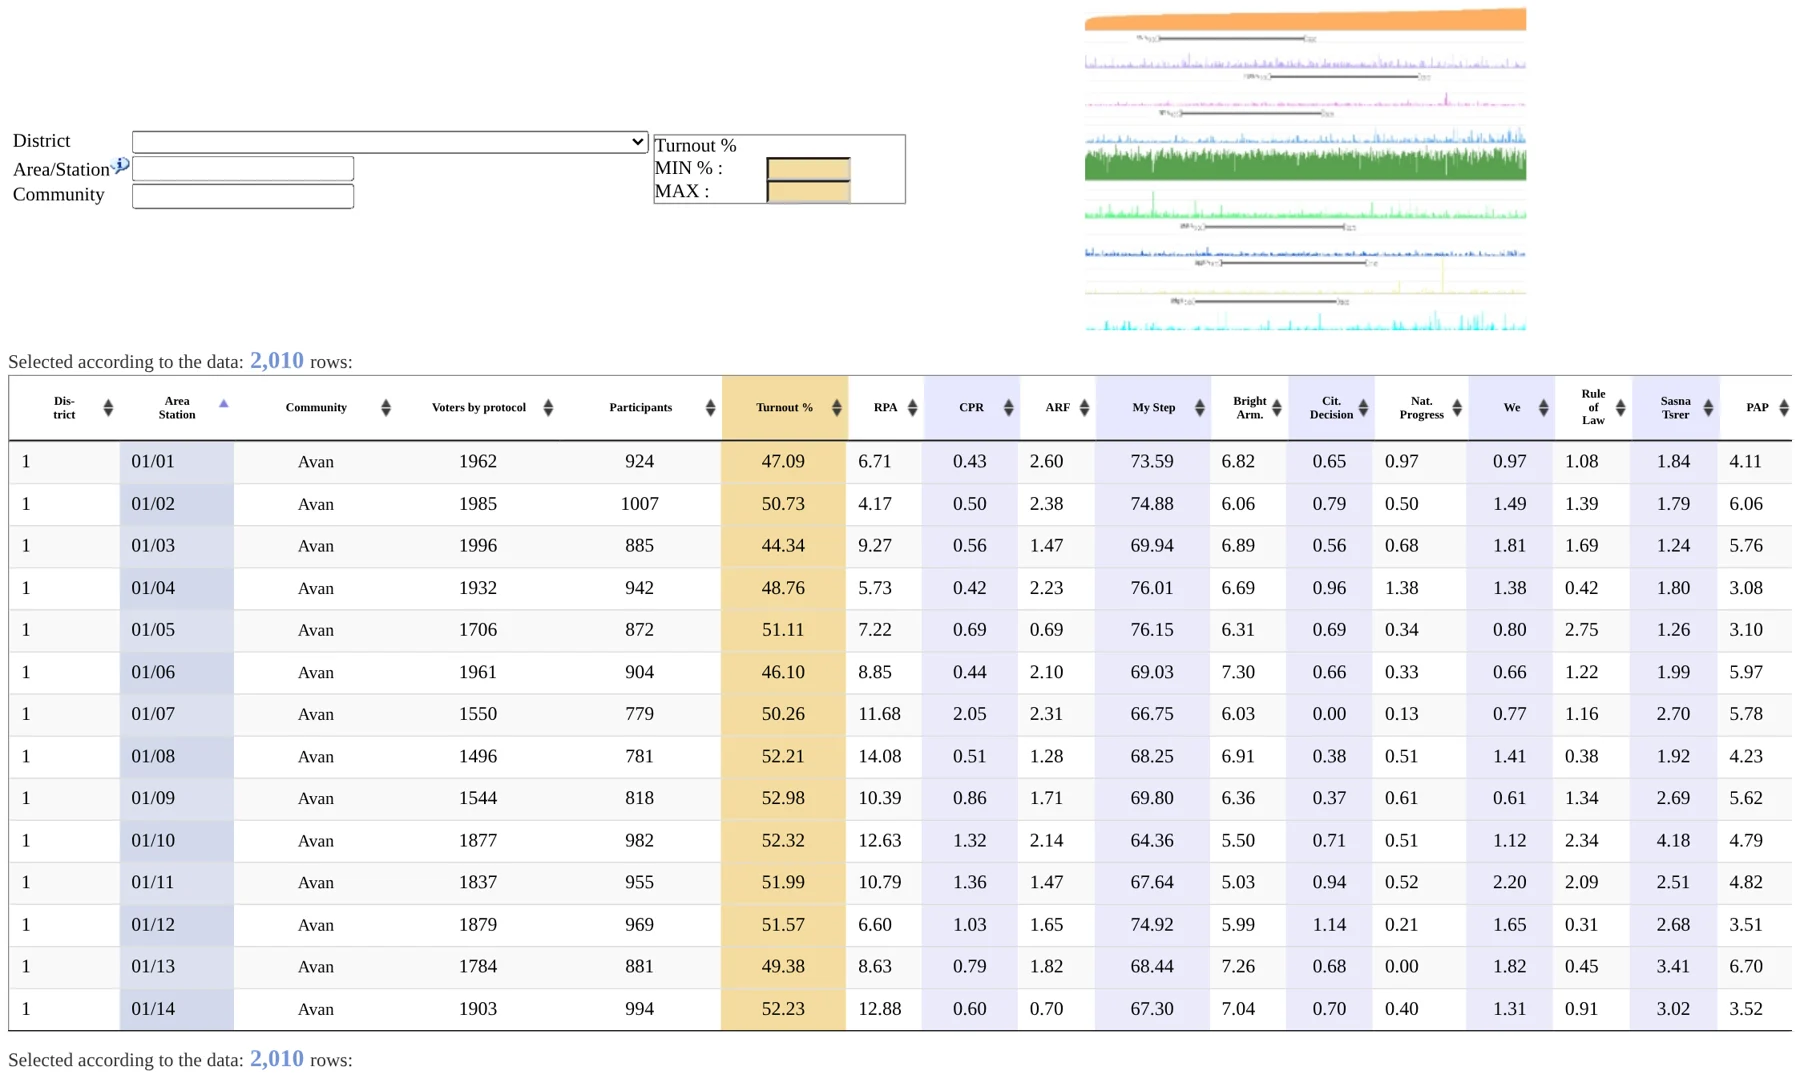
The columns and filters are as in the table in numbers. Each party column is its share of participants at the station; click a column heading to sort the stations by that share.
Lists on the site’s tables, in ballot order: ՀՀԿ Republican Party (RPA); ՔՈՍԴԿ Christian-Popular Renaissance (CPR); ՀՅԴ ARF Dashnaktsutyun; ԻՄ ՔԱՅԼԸ My Step alliance; ԼՀԿ Bright Armenia; ՔԺՎԿ Citizen’s Decision; ԱզգԱԿ National Progress; ՄԵՆՔ We alliance; ՕԵԿ Rule of Law; ՍԾՀԿ Sasna Tsrer; ԲՀԿ Prosperous Armenia (PAP).
What it shows
At Avan 01/01: My Step 73.59%, Bright Armenia 6.82%, RPA 6.71%, PAP 4.11%, ARF 2.60%.
How to read this chart
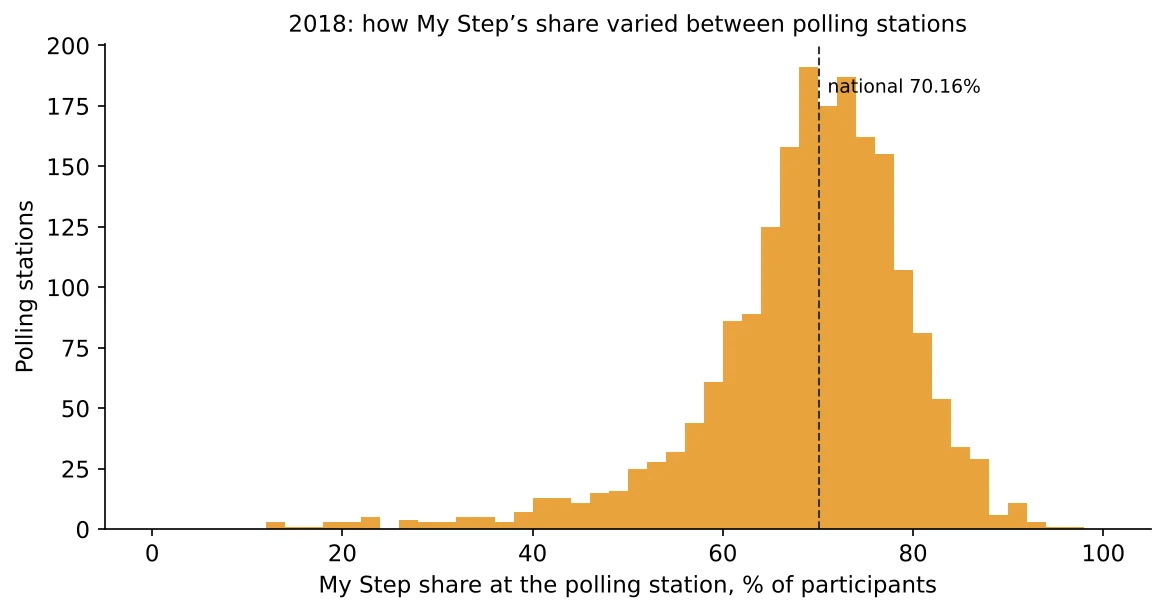
Horizontal: My Step’s share at the station; vertical: the number of stations in each 2-point band. Stations with fewer than 50 participants are left out. The dashed line is the national result.
What it shows
Most stations lie between 60% and 80%, in a single smooth peak near the national figure. 130 stations gave My Step less than half of the vote and 17 gave it 90% or more.
Stations that voted differently
Sorting the columns shows villages where one other list won almost everything:
| Station | Community | Participants | Winner | Share | My Step |
|---|---|---|---|---|---|
| 18/29 | Ashnak (Aragatsotn) | 738 | Bright Armenia | 78.6% | 13.1% |
| 16/57 | Shenik (Armavir) | 438 | ARF | 80.6% | 13.7% |
| 20/16 | Geghamavan (Gegharkunik) | 881 | ARF | 75.4% | 20.7% |
| 11/11 | Azatashen (Ararat) | 395 | Prosperous Armenia | 72.2% | 23.5% |
| 26/35 | Aghavnadzor (Kotayk) | 544 | Prosperous Armenia | 71.0% | 18.9% |
| 17/53 | Charchakis (Aragatsotn) | 193 | Prosperous Armenia | 71.5% | 19.7% |
| 11/29 | Lanjazat (Ararat) | 717 | RPA | 56.9% | 32.1% |
Results like these, where a single village votes almost as one for a party that has a few per cent nationally, usually reflect a local patron or a community leader’s affiliation rather than individual choice. They are few in 2018, and they show up clearly precisely because the rest of the country voted in a narrow range. Charchakis had already appeared in 2013, giving the then ruling candidate 100% (2013 communities).
How the shares relate to turnout: party votes by turnout, 2018.
Data and sources on this site
From the book
This article is based on Chapter VI of Electoral Rights and Election Falsification by Lyudvig Khachatryan, which explains the full method, the formulas and the cases behind it.