Armenia 2018: Election Results by Polling Station, in Votes
The full 2018 result, station by station: My Step 884,471 votes, Prosperous Armenia 103,788, Bright Armenia 80,022; the former ruling RPA 59,074.
Original page on electionscount.info: Voting results in numbers, 2018Armenia held early parliamentary elections on 9 December 2018, half a year after the change of power. Eleven lists stood. Nikol Pashinyan’s My Step alliance won about 70% of the vote; Prosperous Armenia and Bright Armenia also passed the threshold (5% for parties, 7% for alliances). Turnout was 48.6%.
The page “Voting results in numbers” is the complete table of the 2018 result: every one of the 2,010 polling stations with its voters, participants, turnout and the votes for each of the eleven lists.
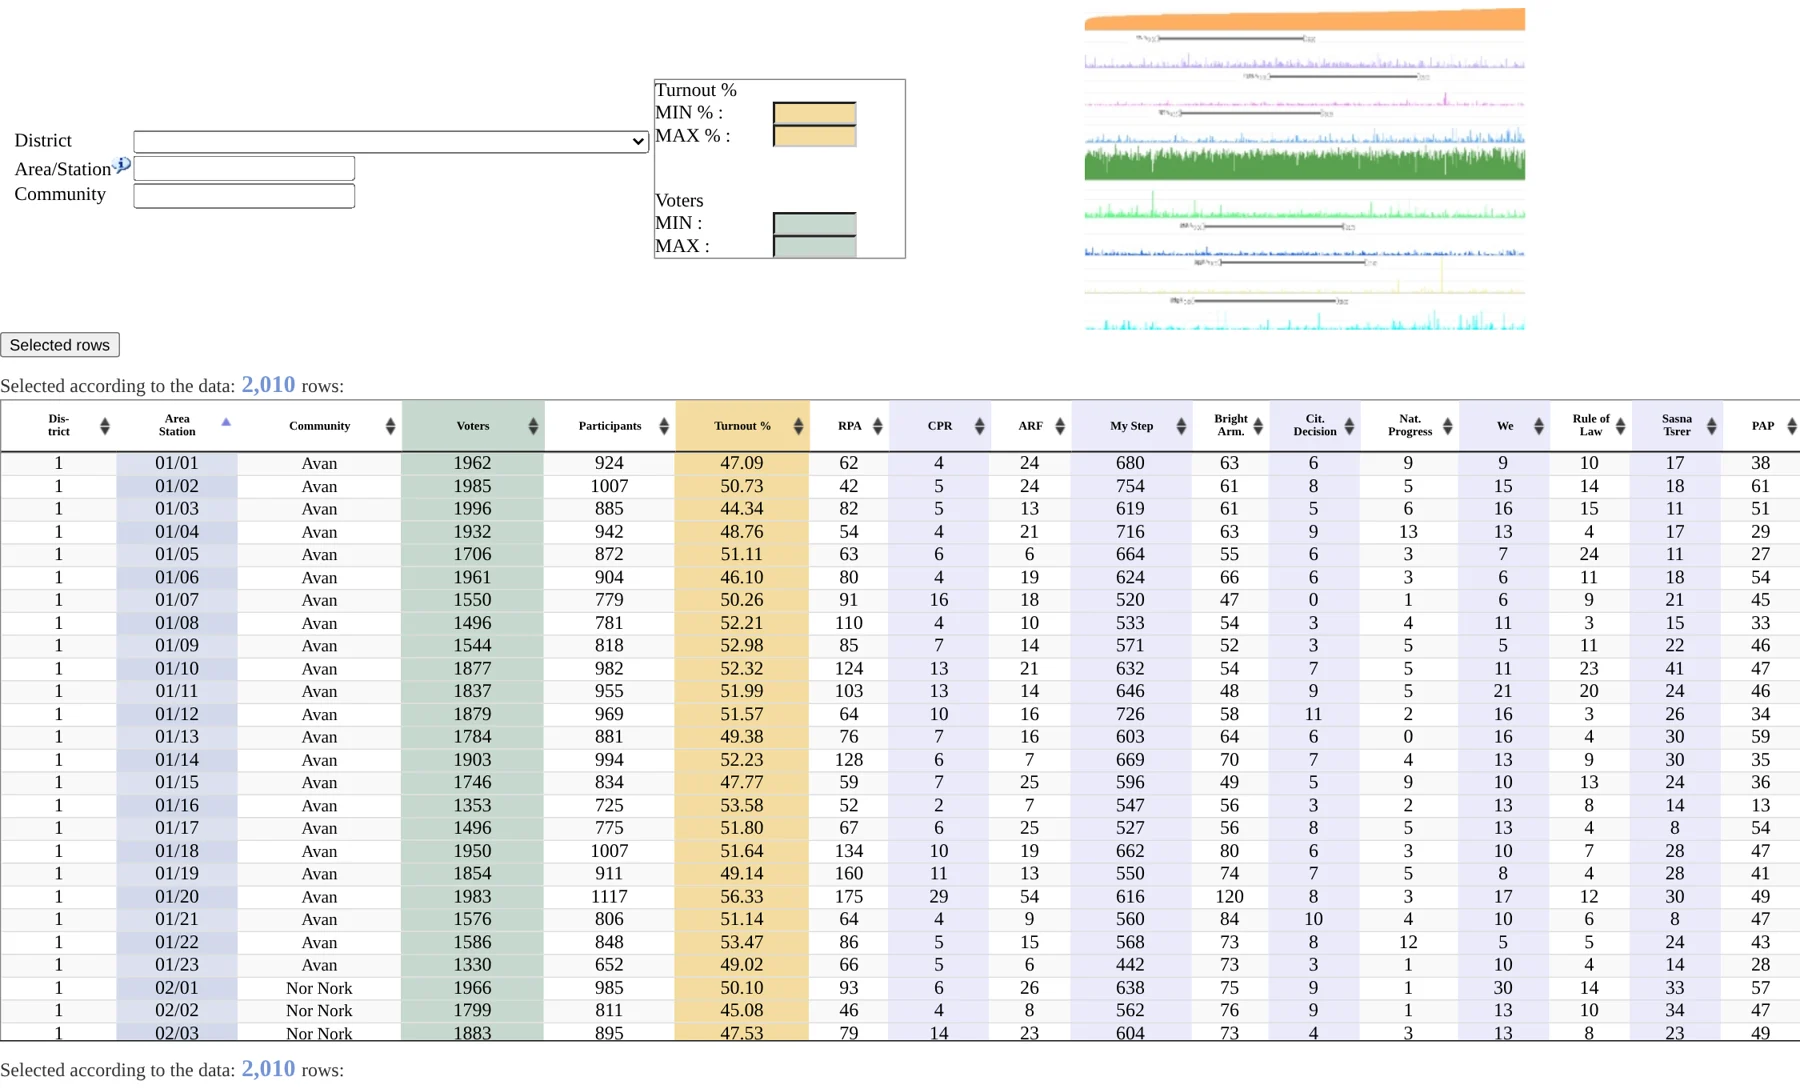
How to read this chart
- District: choose one of the 13 electoral districts: 1–4 Yerevan, 5 Ararat, 6 Armavir, 7 Aragatsotn, 8 Gegharkunik, 9 Lori, 10 Kotayk, 11 Shirak, 12 Syunik and Vayots Dzor, 13 Tavush.
- Area/Station: type the area number and a slash, e.g. 03/, for all stations of area 3. Community: type a name.
- Turnout % and Voters MIN / MAX: filter by turnout or size.
- Selected rows shows the totals of the selection.
- The small chart at the top right links to the turnout chart.
Lists on the site’s tables, in ballot order: ՀՀԿ Republican Party (RPA); ՔՈՍԴԿ Christian-Popular Renaissance (CPR); ՀՅԴ ARF Dashnaktsutyun; ԻՄ ՔԱՅԼԸ My Step alliance; ԼՀԿ Bright Armenia; ՔԺՎԿ Citizen’s Decision; ԱզգԱԿ National Progress; ՄԵՆՔ We alliance; ՕԵԿ Rule of Law; ՍԾՀԿ Sasna Tsrer; ԲՀԿ Prosperous Armenia (PAP).
What it shows
At Avan’s first station, 01/01: 1,962 voters, 924 participants (47.09%), My Step 680 votes, RPA 62, Bright Armenia 63, PAP 38.
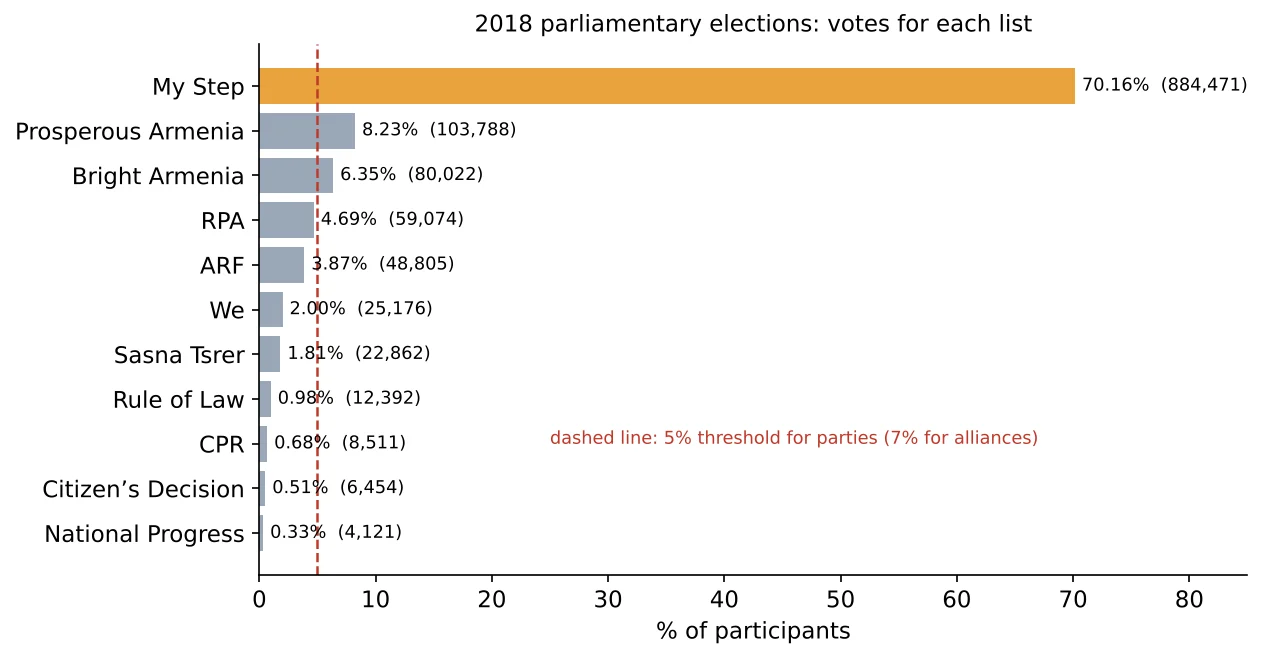
How to read this chart
Each bar is a list’s total in the table as a share of the 1,260,601 participants, with its votes. The dashed line is 5%.
What it shows
My Step 884,471 votes; Prosperous Armenia 103,788; Bright Armenia 80,022. RPA, which had governed until spring 2018, received 59,074 votes (4.69%) and dropped out of parliament. 4,925 participants did not cast a valid vote for any list.
By electoral district
| District | Turnout | My Step | PAP | Bright Armenia | RPA | ARF |
|---|---|---|---|---|---|---|
| 1 Yerevan (Avan, Nor Nork, Kanaker-Zeytun) | 48.4 | 69.9 | 5.7 | 7.9 | 6.9 | 2.2 |
| 2 Yerevan (Arabkir, Ajapnyak, Davtashen) | 49.3 | 69.9 | 4.2 | 7.3 | 7.9 | 2.6 |
| 3 Yerevan (Malatia-Sebastia, Shengavit) | 46.5 | 76.4 | 3.2 | 7.3 | 4.3 | 1.5 |
| 4 Yerevan (Kentron, Nork-Marash, Erebuni, Nubarashen) | 46.3 | 70.7 | 5.6 | 7.5 | 6.4 | 2.2 |
| 5 Ararat | 50.6 | 72.4 | 8.1 | 3.9 | 6.4 | 2.4 |
| 6 Armavir | 44.3 | 66.9 | 11.5 | 8.4 | 2.6 | 3.9 |
| 7 Aragatsotn | 52.1 | 68.6 | 10.1 | 6.7 | 2.1 | 6.3 |
| 8 Gegharkunik | 50.4 | 70.5 | 8.6 | 4.7 | 2.8 | 7.0 |
| 9 Lori | 47.6 | 69.1 | 8.2 | 8.1 | 7.0 | 2.5 |
| 10 Kotayk | 48.9 | 67.5 | 16.4 | 3.5 | 3.5 | 4.1 |
| 11 Shirak | 45.1 | 65.6 | 10.7 | 8.1 | 2.9 | 6.4 |
| 12 Syunik and Vayots Dzor | 55.9 | 72.4 | 7.9 | 4.6 | 3.2 | 4.7 |
| 13 Tavush | 53.0 | 73.7 | 4.7 | 3.5 | 2.4 | 7.3 |
Shares are % of participants. My Step was strongest in district 3 (Malatia-Sebastia and Shengavit, 76.4%) and weakest in Shirak (65.6%). Prosperous Armenia, the party of Gagik Tsarukyan, had its best result in Kotayk (16.4%), his home province.
The same results as percentages, with the stations that voted differently from the country, are in results in percent. The charts by province and by Yerevan district are in results by province and results by Yerevan district.
Data and sources on this site
From the book
This article is based on Chapter VI of Electoral Rights and Election Falsification by Lyudvig Khachatryan, which explains the full method, the formulas and the cases behind it.