Yerevan Electoral District 1: Turnout and Voting Speed at Every Polling Station, 2017–2021
Yerevan Electoral District 1: turnout 60.69% in 2017, 48.43% in 2018 and 52.94% in 2021; 1, 0 and 0 stations above physical capacity.
Original page on electionscount.info: Turnout and voting speed table (choose the year with the buttons)Yerevan Electoral District 1 covers Avan, Nor Nork and Kanaker-Zeytun. The charts and tables below use every polling station of the district from the site's turnout tables for the three parliamentary elections.
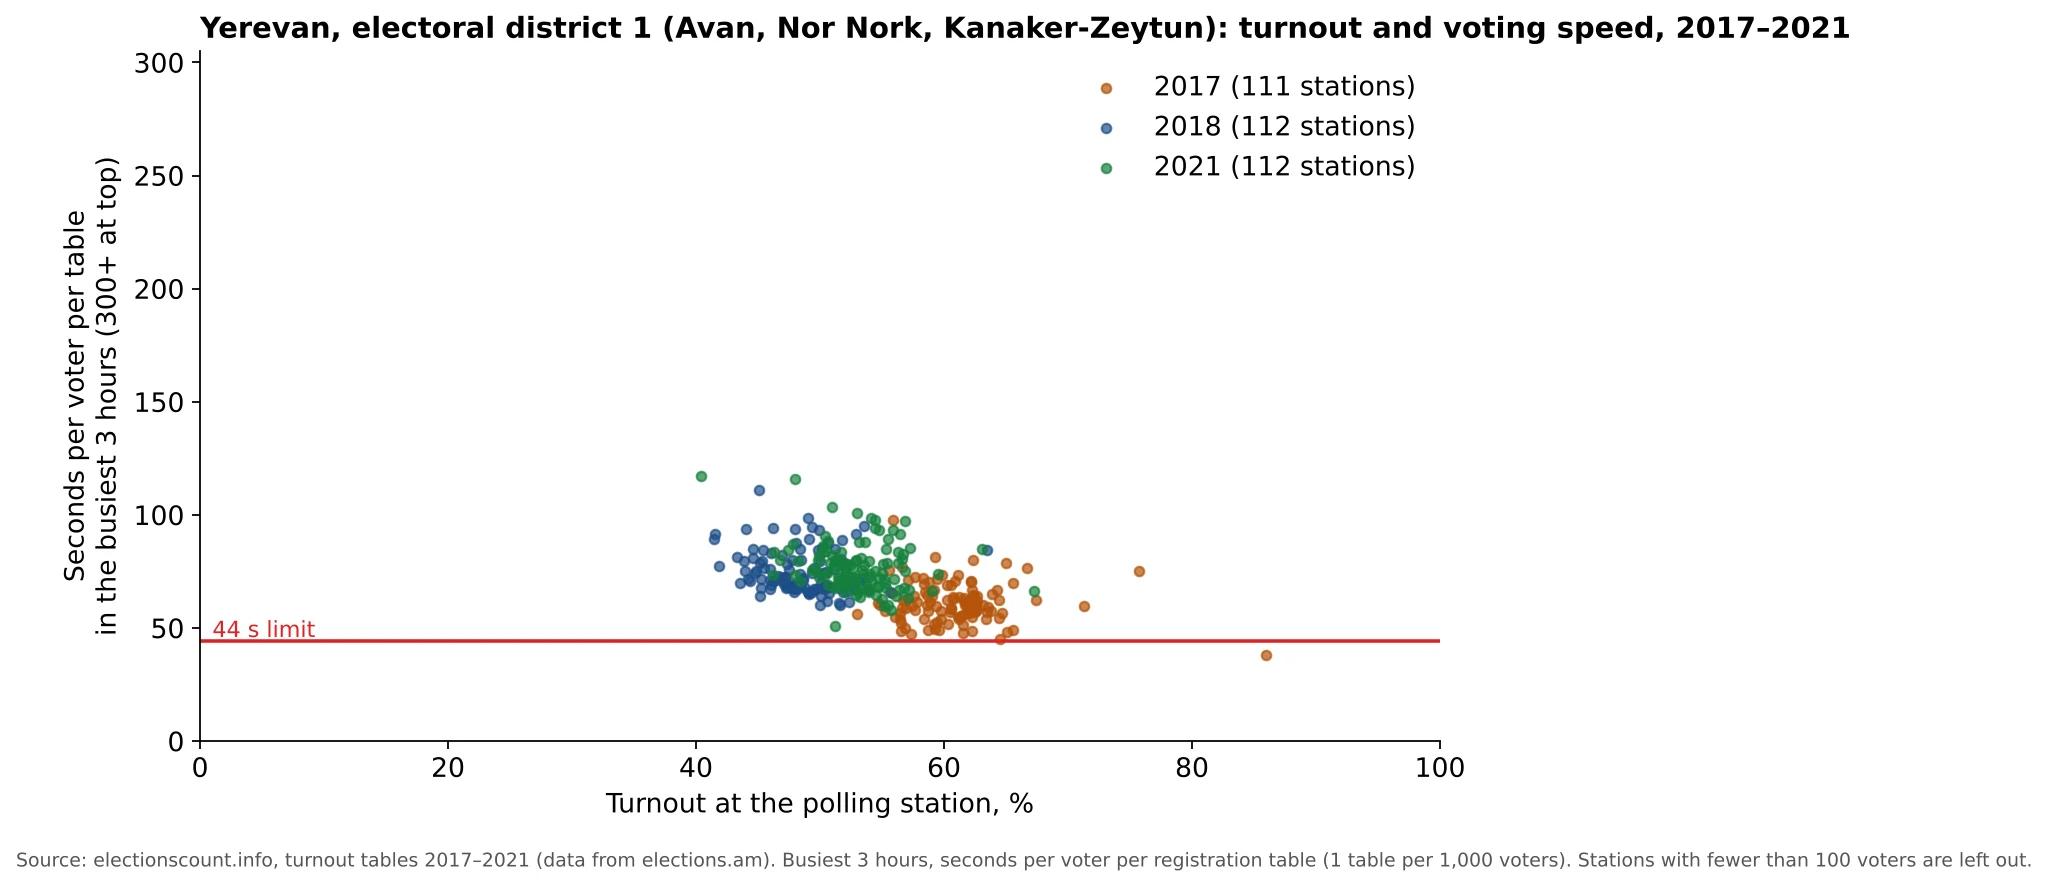
How to read this chart
Each dot is one polling station in one year: orange 2017, blue 2018, green 2021. Left to right: turnout. Bottom to top: how many seconds per voter per registration table the station needed in its busiest 3 hours, so lower means faster. Dots below the red line voted faster than one table can register people.
What it shows
In 2017 station 2/05 in Nor Nork reported 85.94% turnout and 566 voters in its busiest 3 hours on two tables, faster than the limit. Station 2/49, also in Nor Nork, is one of the two 2017 stations where the count went down: 61 fewer people at 20:00 than at 17:00. In 2018 and 2021 no station here came near the limit.
The district in numbers
| Year | Stations | Voters | Turnout | Typical seconds per voter per table | Under 60 s | Above capacity (under 44 s) | Turnout 75%+ (100+ voters) |
|---|---|---|---|---|---|---|---|
| 2017 | 112 | 200,217 | 60.69% | 60.0 | 55 | 1 | 2 |
| 2018 | 112 | 200,915 | 48.43% | 71.8 | 0 | 0 | 0 |
| 2021 | 112 | 202,704 | 52.94% | 75.1 | 3 | 0 | 0 |
The three fastest stations each year
| Year | Station | Community | Voters | Most in 3 hours | Tables | Seconds per voter per table |
|---|---|---|---|---|---|---|
| 2017 | 2/05 | Nor Nork | 1,629 | 566 | 2 | 38.2 |
| 2017 | 2/07 | Nor Nork | 1,907 | 478 | 2 | 45.2 |
| 2017 | 3/01 | Kanaker-Zeytun | 1,978 | 455 | 2 | 47.5 |
| 2018 | 01/18 | Avan | 1,950 | 360 | 2 | 60.0 |
| 2018 | 02/38 | Nor Nork | 1,893 | 359 | 2 | 60.2 |
| 2018 | 01/12 | Avan | 1,879 | 354 | 2 | 61.0 |
| 2021 | 03/14 | Kanaker-Zeytun | 1,897 | 423 | 2 | 51.1 |
| 2021 | 02/42 | Nor Nork | 1,876 | 373 | 2 | 57.9 |
| 2021 | 02/03 | Nor Nork | 1,868 | 361 | 2 | 59.8 |
To see any of these stations on the site, open the table, choose the year with the buttons 2021, 2018 or 2017, and type the station number.
The capacity rule used here. Registering one voter at one table, checking the ID and handing out the ballot and envelope takes at least about 44 seconds. The Electoral Code (Article 64) gives each polling station at least one registration member per 1,000 voters, so a station with up to 1,000 voters is counted as having one table, up to 2,000 voters two tables. The "seconds per voter per table" figure is the station's fastest 3-hour average multiplied by its number of tables. Below 44 seconds, the reported turnout is faster than the station could physically register people.
Data and sources on this site
From the book
This article is based on Chapter VI of Electoral Rights and Election Falsification by Lyudvig Khachatryan, which explains the full method, the formulas and the cases behind it.