Shirak Province: Turnout and Voting Speed at Every Polling Station, 2015–2026
Shirak Province: polling stations faster than the 44-second limit numbered 3 in 2015, 4 in 2017, 0 in 2018, 0 in 2021 and 2 in 2026.
Original page on electionscount.info: Turnout and voting speed tables, 2017–2026This article compares every polling station of the province in five votes: the constitutional referendum of 2015 and the parliamentary elections of 2017, 2018, 2021 and 2026. The numbers come from the official turnout reports published every three hours, collected in the site's tables.
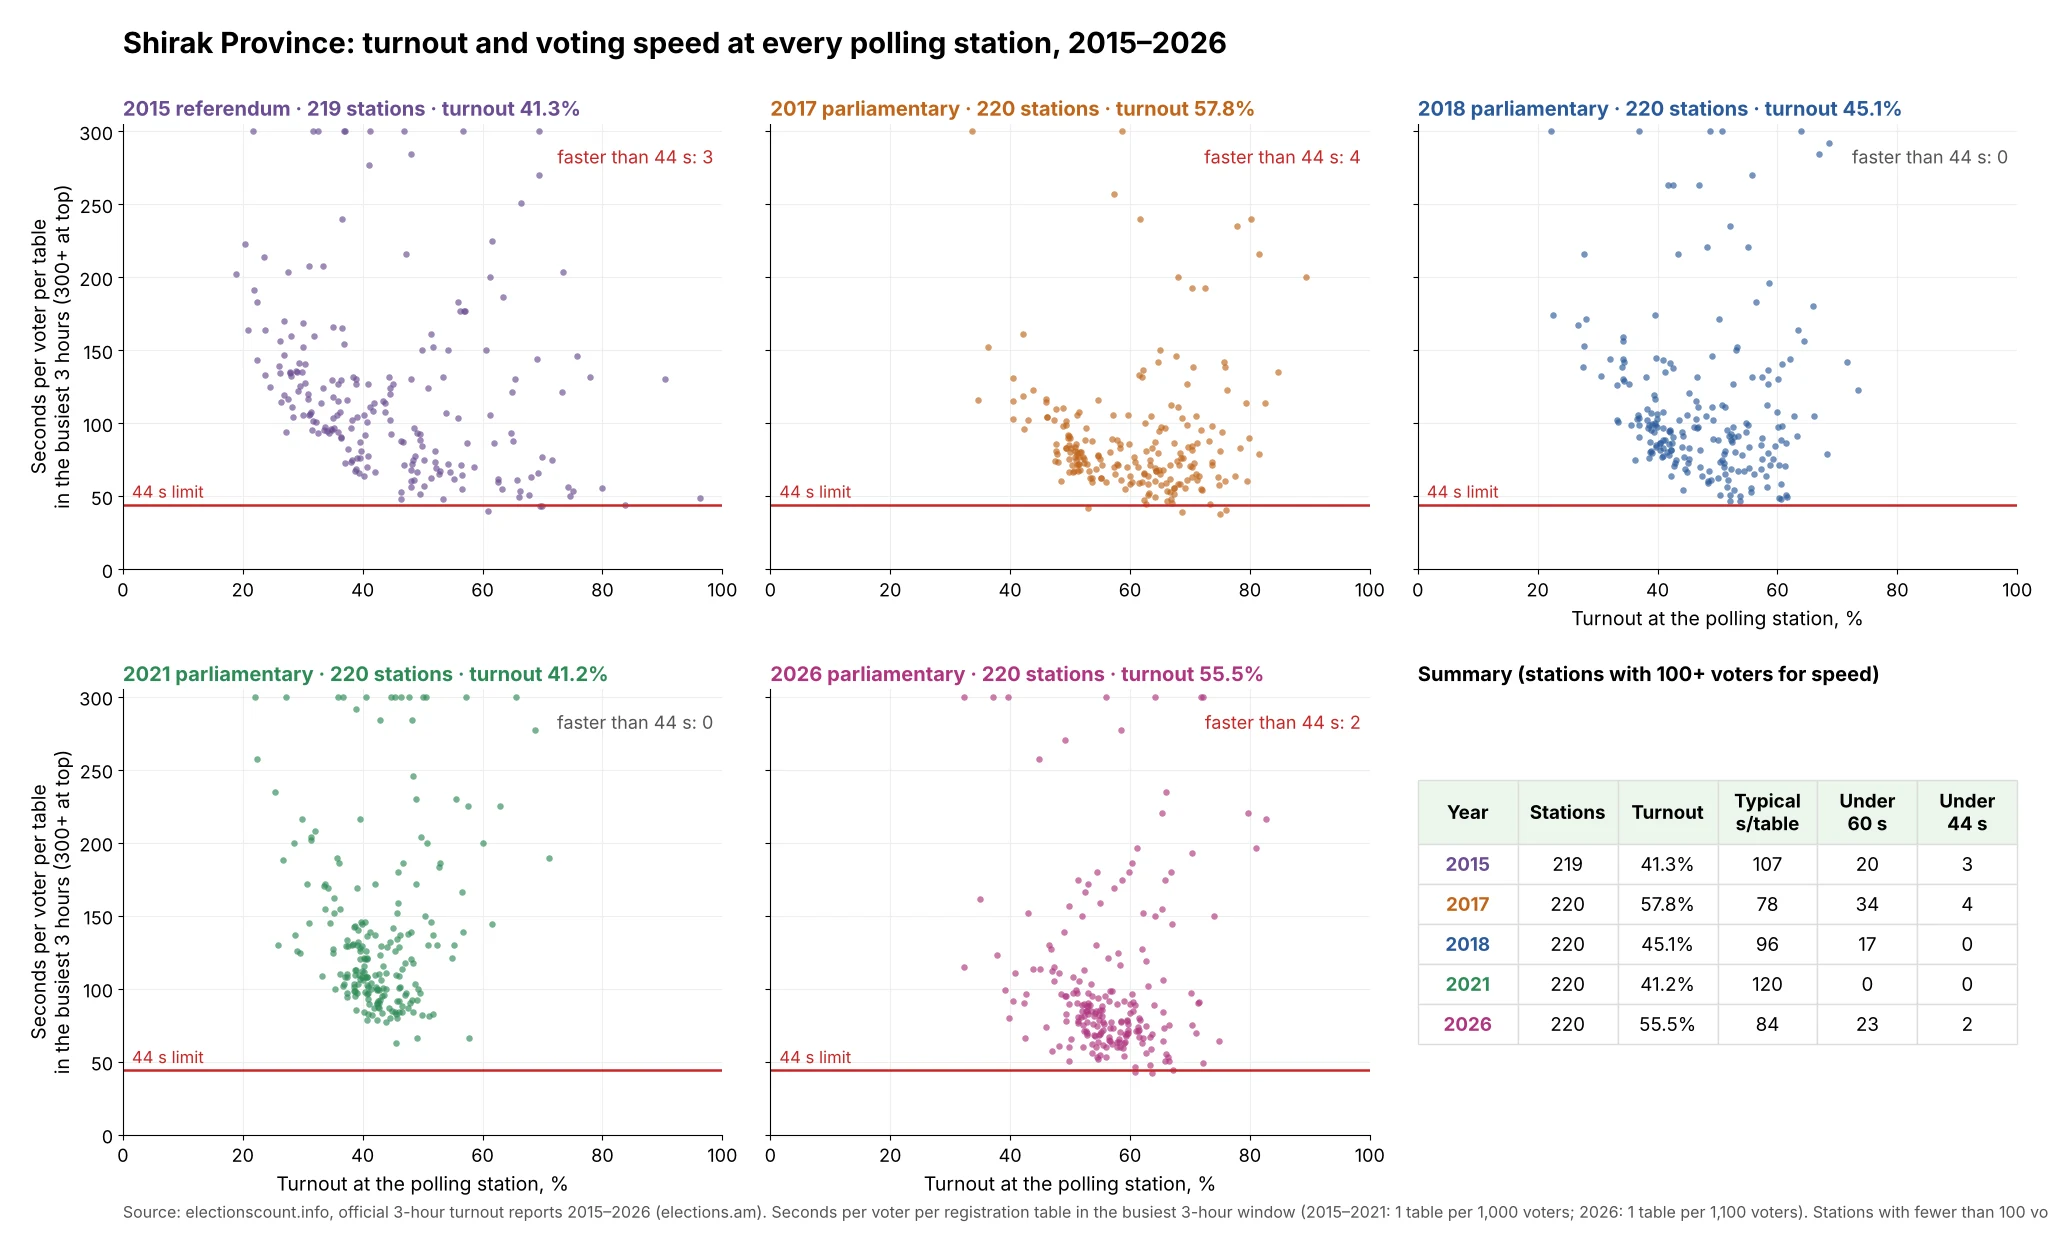
How to read this chart
Each panel is one vote, with the same axes: purple the 2015 referendum, orange 2017, blue 2018, green 2021, pink 2026. Each dot is one polling station. Left to right: turnout. Bottom to top: seconds per voter per registration table in the station's busiest 3 hours, so lower means faster. Dots below the red line voted faster than one table can register people. The sixth box sums up each year.
What it shows
Faster than 44 seconds: 3 stations in 2015, 4 in 2017, 0 in 2018, 0 in 2021 and 2 in 2026. Typical speed: 106.7, 78.5, 95.6, 120.0 and 83.6 seconds per voter per table.
From 2021 to 2026 the dots moved back toward the red line: stations under 60 seconds went from 0 to 23, still fewer than the 34 of 2017.
Five votes in numbers
| Year | Stations | Voters | Turnout | Typical seconds per voter per table | Under 60 s | Above capacity (under 44 s) | Turnout 75%+ (100+ voters) |
|---|---|---|---|---|---|---|---|
| 2015 | 219 | 230,536 | 41.28% | 106.7 | 20 | 3 | 7 |
| 2017 | 220 | 230,701 | 57.76% | 78.5 | 34 | 4 | 19 |
| 2018 | 220 | 229,798 | 45.13% | 95.6 | 17 | 0 | 0 |
| 2021 | 220 | 226,763 | 41.24% | 120.0 | 0 | 0 | 0 |
| 2026 | 220 | 207,820 | 55.46% | 83.6 | 23 | 2 | 3 |
What improved and what got worse
2026 compared with 2017, the last election before it with high turnout, and with 2021, the election just before it. For the stations and the counts, fewer is better; for the typical seconds, more is better, because it means calmer voting.
| Measure | 2017 → 2026 | 2021 → 2026 |
|---|---|---|
| Stations faster than 44 seconds | 4 → 2, better | 0 → 2, worse |
| Stations under 60 seconds | 34 → 23, better | 0 → 23, worse |
| Typical seconds per voter per table | 78.5 → 83.6, better | 120.0 → 83.6, worse |
| Stations with turnout of 75% or more (100+ voters) | 19 → 3, better | 0 → 3, worse |
| Turnout | 57.76% → 55.46%, lower | 41.24% → 55.46%, higher |
In short. Compared with 2017: 4 of the four measures better, 0 worse. Compared with 2021: 0 better, 4 worse. The number of stations faster than physically possible rose from 0 in 2021 to 2 in 2026.
Part of the change comes from turnout, which went from 41.24% in 2021 to 55.46% in 2026: busier stations vote faster. For comparison, in 2017, at a turnout of 57.76%, there were 34 stations under 60 seconds and 4 faster than 44 seconds; in 2026 there were 23 and 2.
How to read the changes. Fast voting alone does not prove fraud: a station is busy when many people really come. But no station can register people faster than about 44 seconds per voter per table, so dots below the red line are impossible as reported, and a cluster of stations close to the line with very high turnout is the pattern the method flags for checking. A move away from the line is an improvement; a move toward it is a warning sign.
The three fastest stations each year
| Year | Station | Voters | Most in 3 hours | Tables | Seconds per voter per table |
|---|---|---|---|---|---|
| 2015 | 36/06 | 1,905 | 540 | 2 | 40.0 |
| 2015 | 36/10 | 892 | 250 | 1 | 43.2 |
| 2015 | 36/22 | 939 | 250 | 1 | 43.2 |
| 2017 | 33/22 | 935 | 285 | 1 | 37.9 |
| 2017 | 30/54 | 971 | 274 | 1 | 39.4 |
| 2017 | 33/17 | 892 | 266 | 1 | 40.6 |
| 2018 | 32/01 | 1,944 | 466 | 2 | 46.4 |
| 2018 | 30/62 | 974 | 232 | 1 | 46.6 |
| 2018 | 33/38 | 924 | 225 | 1 | 48.0 |
| 2021 | 33/22 | 951 | 172 | 1 | 62.8 |
| 2021 | 33/12 | 829 | 164 | 1 | 65.9 |
| 2021 | 33/17 | 891 | 163 | 1 | 66.3 |
| 2026 | 33/20 | 1,074 | 257 | 1 | 42.0 |
| 2026 | 33/43 | 1,014 | 252 | 1 | 42.9 |
| 2026 | 32/19 | 1,076 | 243 | 1 | 44.4 |
To check any of these stations, open the table for that year: 2015, 2017, 2018, 2021 or 2026, and type the station number.
The capacity rule used here. Registering one voter at one table, checking the ID and handing out the ballot and envelope takes at least about 44 seconds; this figure is our estimate, not a number from the law. The number of tables is the minimum the Electoral Code (Article 64) required at the time of each vote: one registration member per 1,000 voters in 2015–2021 and one per 1,100 voters in 2026 (see how the rule changed). The "seconds per voter per table" figure is the station's fastest 3-hour average multiplied by its number of tables. Below 44 seconds, the reported turnout is faster than the station could physically register people.
Two more rules for this comparison. Stations with fewer than 100 voters are left out of the dots and of the speed counts, and so are stations whose reported count went down from one 3-hour report to the next, because such reports cannot be right; all stations count in the turnout. The 2015 referendum used the same polling stations and the same 3-hour reports as the elections, but different station numbers, so it is matched to the other votes by province.
Data and sources on this site
From the book
This article is based on Chapter VI of Electoral Rights and Election Falsification by Lyudvig Khachatryan, which explains the full method, the formulas and the cases behind it.